uitable - Create table user interface component - MATLAB (original) (raw)
Create table user interface component
Syntax
Description
`uit` = uitable creates a table UI component in the current figure and returns the Table UI component object. If there is no figure available, MATLAB® calls the figure function to create one.
`uit` = uitable([parent](#br5rl9k-parent)) creates a table in the specified parent container. The parent container can be aFigure object or a child container such as a panel.
`uit` = uitable(___,[Name,Value](#namevaluepairarguments)) specifies table properties using one or more name-value arguments. Use this option with any of the input argument combinations in the previous syntaxes.
Examples
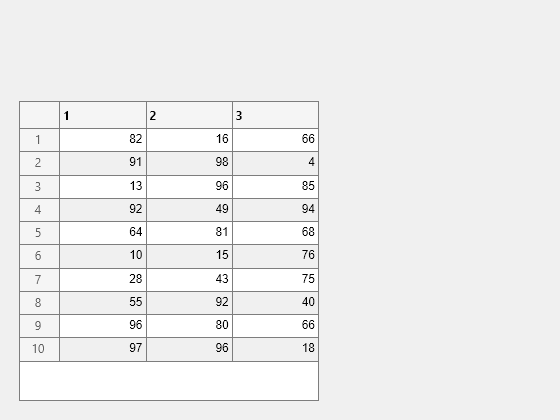
Create a table UI component that displays a 10-by-3 array of random integers.
fig = uifigure; uit = uitable(fig,"Data",randi(100,10,3));
Create a table array t with different data types by reading data from a file. Select the first 15 rows of four variables from t.
t = readtable("patients.xls"); vars = ["Age","Systolic","Diastolic","Smoker"]; t = t(1:15,vars);
Create a table UI component to display the tabular data. The data type determines how the data appears in the component. For example, logical data displays as a check box. For more information, see Format Tabular Data in Apps.
fig = uifigure; uit = uitable(fig,"Data",t,"Position",[20 20 350 300]);

Display and programmatically update data in a table UI component.
Create a table array by reading in tsunami data from a file, and display a subset of the data in a table UI component.
t = readtable("tsunamis.xlsx"); vars = ["Year","MaxHeight","Validity"]; t = t(1:20,vars); fig = uifigure; uit = uitable(fig,"Data",t);

Update the validity of the tsunami in the first row by editing the Data property of the table UI component.
uit.Data.Validity(1) = {'definite tsunami'};

Convert the maximum height data from meters to feet by accessing and modifying the data in the MaxHeight variable.
uit.Data.MaxHeight = uit.Data.MaxHeight*3.281;

Create an app that allows users to sort and edit table data, and that updates a data visualization when data is changed.
In a file named tableDataApp.m, write a function that implements the app:
- Create a
tablearray of tsunami data. - Create a UI figure with a grid layout manager.
- Create a sortable and editable table UI component in the figure. Store the
tablearray in the componentDataproperty. - Create a bubble chart to visualize the tsunami data, where the coordinates of a bubble represent the latitude and longitude of the tsunami and the size of the bubble represents the maximum height.
- Update the bubble chart when the app user sorts columns or edits cells in the table UI component by writing a
DisplayDataChangedFcncallback. For more information about callbacks, see Create Callbacks for Apps Created Programmatically.
function tableDataApp % Create table array t = readtable("tsunamis.xlsx"); vars = ["Latitude","Longitude","MaxHeight"]; t = t(1:20,vars);
% Create UI figure fig = uifigure; fig.Position(3:4) = [722 360]; gl = uigridlayout(fig,[1 2]);
% Create table UI component uit = uitable(gl); uit.Data = t; uit.ColumnSortable = true; uit.ColumnEditable = [false false true];
% Create bubble chart ax = geoaxes(gl); lat = t.Latitude; long = t.Longitude; sz = t.MaxHeight; bubblechart(ax,lat,long,sz)
% Specify table callback uit.DisplayDataChangedFcn = @(src,event) updatePlot(src,ax); end
function updatePlot(src,ax) t = src.DisplayData; lat = t.Latitude; long = t.Longitude; sz = t.MaxHeight; bubblechart(ax,lat,long,sz) end
Run the app.

A sortable column displays arrows in the header when you point to it. Sort the table by the maximum height of the tsunamis.

Edit the maximum height of the tsunami in the second row to be 30 meters by double-clicking the table cell and entering the new height. The bubble chart updates in response.

Style rows, columns, or cells of a table UI component using the uistyle and addStyle functions.
Read tsunami sample data into the workspace as a table array. Then, create a table UI component to display the data.
tdata = readtable("tsunamis.xlsx"); vars = ["Year","Month","Day","Hour", ... "Cause","EarthquakeMagnitude"]; tdata = tdata(1:20,vars);
fig = uifigure("Position",[500 500 760 360]); uit = uitable(fig, ... "Data",tdata, ... "Position",[20 20 720 320]);
Use the ismissing function to get a logical array of the table elements that contain missing values. Find the row and column subscripts for the elements that have NaN values. Finally, create a red background color style and add it to the cells in the table with NaN.
styleIndices = ismissing(tdata); [row,col] = find(styleIndices);
s = uistyle("BackgroundColor",[1 0.6 0.6]); addStyle(uit,s,"cell",[row,col]);

Create an app that plots data on a map when the app user selects the data in a table.
In a file named selectTsunamis.m, write a function that implements the app:
- Load the tsunami data.
- Create a UI figure with a table UI component and a geographic bubble chart in a grid layout manager.
- Configure the table UI component. Store the tsunami data in the
Dataproperty, and let users select multiple rows by setting theSelectionTypeandMultiselectproperties. - Specify a
SelectionChangedFcncallback that updates the bubble chart when the app user changes the table selection. TheplotTsunamicallback function plots a bubble for each selected row, where the size of the bubble represents the maximum tsunami height. For more information about callbacks, see Create Callbacks for Apps Created Programmatically.
function selectTsunamis % Load data t = readtable("tsunamis.xlsx"); vars = ["Latitude","Longitude","MaxHeight"]; t = t(1:20,vars);
% Create UI components fig = uifigure("Position",[100 100 800 350]); gl = uigridlayout(fig,[1 2]); gl.ColumnWidth = {'1x','2x'}; tbl = uitable(gl); gb = geobubble(gl,[],[]);
% Configure table
tbl.Data = t;
tbl.SelectionType = "row";
tbl.Multiselect = "on";
tbl.SelectionChangedFcn = @(src,event) plotTsunami(src,event,gb);
end
% Plot tsunami data for each selected row function plotTsunami(src,event,gb) rows = event.Selection; data = src.Data(rows,:); gb.LatitudeData = data.Latitude; gb.LongitudeData = data.Longitude; gb.SizeData = data.MaxHeight; end
Run the app.

Select multiple table rows by holding Ctrl while clicking. The plot updates with the selected tsunami data.

Since R2021a
Programmatically scroll to a row, column, or cell of a table UI component using the scroll function.
Read sample patient data into the workspace as a table array. Then, create a table UI component to display the data.
tdata = readtable("patients.xls"); vars = ["Age","Systolic","Diastolic","Smoker"]; tdata = tdata(1:40,vars);
fig = uifigure; uit = uitable(fig,"Data",tdata); uit.RowName = "numbered";

Scroll to the 25th row of the table.

Input Arguments
Parent container, specified as a figure created with either the figure or uifigure function, or a child container in a figure, such as a panel, tab, button group, or grid layout manager.
Name-Value Arguments
Specify optional pairs of arguments asName1=Value1,...,NameN=ValueN, where Name is the argument name and Value is the corresponding value. Name-value arguments must appear after other arguments, but the order of the pairs does not matter.
Example: uitable(Data=[1 2 3; 4 5 6]) creates a table UI component with the specified data.
Before R2021a, use commas to separate each name and value, and enclose Name in quotes.
Example: uitable("Data",[1 2 3; 4 5 6]) creates a table UI component with the specified data.
Note
The properties listed here are a subset of the available properties. For the full list, see Table.
Table data, specified as one of the following types of array:
- Table array — Displays any combination of data types that table arrays support, such as datetime, duration, and categorical.
- Numeric array — Displays numeric values such as
doubleorsingle. - Logical array — Displays check boxes.
truevalues correspond to selected boxes, whereasfalsevalues display cleared boxes. - Cell array — Displays any combination of numeric, logical, or character array values.
- String array — Displays characters and text.
- Cell array of character vectors — Displays characters and text.
To prevent warnings or NaN values that display when users enter invalid data into an editable cell, write a CellEditCallback function to convert the data to the appropriate type. When a user edits a cell, the Data property updates.
Specify a Table Array
You can specify the Data property as a table array. Table arrays provide a convenient way to store tabular data as a MATLAB variable. The table, readtable, and array2table functions create table arrays. By contrast, the uitable function creates aTable UI component (a user interface component for an app).
When you specify the Data property of a Table UI component as a table array, then MATLAB sets the format of the Table UI component automatically based on the values in the table array:
- By default, the column names displayed in the app match the
VariableNamesproperty of the table array. Changing theColumnNameproperty of theTableUI component updates the UI, but it does not update the variable names in the table array. - By default, the row names displayed in the app match the
RowNameproperty of the table array. Changing theRowNameproperty of theTableUI component updates the UI, but it does not update the row names in the table array. - The data type of each table array variable controls formatting for the corresponding column in the app. If you try to set the
ColumnFormatproperty, MATLAB returns a warning.
For more information on displaying table array data, see Format Tabular Data in Apps.
Specify Numeric, Logical, Cell, String Array, or Cell Array of Character Vectors
Use the ColumnFormat property to specify the format for data that is a numeric, logical, cell, or string array, or a cell array of character vectors. If data is edited and results in a mismatch between the data type of the data and theColumnFormat property, MATLAB converts the data or displays a warning. See the ColumnFormat property description for more information.
Width of table columns, specified as 'auto', '1x','fit', or as a 1-by-n cell array of character vectors, strings, and numeric values.
- Automatic widths — Specify
'auto'to have MATLAB calculate the widths of the columns automatically using several factors, one of which is theColumnNameproperty value. - Fit widths to content — Specify a value of
'fit'to configure columns to strictly adjust widths to fit column names and data. This setting allows narrower columns than'auto'does. - Uniform widths — Specify a value of
'1x'to make all columns the same width, dividing the available space equally. - Fixed widths — Specify a cell array of numeric values that define the column widths in pixel units.
- Combinations — You can combine fixed and variable column widths in a cell array. Each element in the cell array corresponds to a column in the table. If the cell array you specify has fewer values than the number of columns, then the columns with no specified value keep the default value of
'auto'. If the array has more values than the number of columns, MATLAB ignores the extra values. - Weighted variable widths — Specify a cell array with character vectors or strings composed of a number concatenated with an
'x'(for example,'2x','3x', etc.). The x-factor of each column sets that column width proportionally with respect to the others, with consideration for the remaining space in the UI table.
If a user interactively resizes a table column in a running app, the resized column width persists even if you later update the ColumnWidth property.
Example: uit = uitable(uifigure,'ColumnWidth','auto','Data',[1 2 3;4 5 6])
Example: uit = uitable(uifigure,'ColumnWidth','fit','Data',[1 2 3;4 5 6])
Example: uit = uitable(uifigure,'ColumnWidth',{64,60,40},'Data',[1 2 3;4 5 6])
Example: uit = uitable(uifigure,'ColumnWidth',{'2x','1x','1x'},'Data',[1 2 3;4 5 6])
Example: uit = uitable(uifigure,'ColumnWidth',{64,"auto",40},'Data',[1 2 3;4 5 6])
Example: uit = uitable(uifigure,'ColumnWidth',{'fit','1x','3x'},'Data',[1 2 3;4 5 6])
Ability to edit column cells, specified as:
- An empty logical array (
[]) — No columns are editable. - A logical 1-by-
narray — This array specifies which columns are editable. The value ofnis equal to the number of columns in the table. Each value in the array corresponds to a table column. A value oftruein the array makes the cells in that column editable. A value offalsemakes the cells in that column uneditable. If the array has more values than the number of columns, MATLAB ignores the excess values. If the array has fewer values than the number of columns, then the columns with no specified value are not editable. - A logical scalar — The entire table is editable or uneditable.
When a user edits a cell, the Data property updates.
Example: uit = uitable(uifigure,'Data',rand(10,3),'ColumnEditable',[false true true])
Example: uit = uitable(uifigure,'Data',rand(10,3),'ColumnEditable',false)
To enable users to interact with the controls in table columns that contain check boxes or pop-up menus, set the ColumnEditable property to true.
If the Data property is a table array, then any variables that are multicolumn or contain non-editable data types, like duration, are not editable in the running app even when the ColumnEditable property is true. Table array variables that contain mixed data types in a cell array are editable in the running app, as long as the data types are editable.
Cell edit callback function, specified as one of these values:
- A function handle.
- A cell array in which the first element is a function handle. Subsequent elements in the cell array are the arguments to pass to the callback function.
- A character vector containing a valid MATLAB expression (not recommended). MATLAB evaluates this expression in the base workspace.
Use this callback function to perform calculations or validate input when the app user changes the contents of a table cell.
This callback function can access specific information about the user’s interaction with the cell (such as the cell indices). MATLAB passes this information in a CellEditData object as the second argument to your callback function. In App Designer, the argument is called event. You can query the object properties using dot notation. For example, event.Indices returns the indices of the selected cell. The CellEditData object is not available to callback functions specified as character vectors.
The following table describes properties of the CellEditData object.
| Property | Description |
|---|---|
| Indices | This is a 1-by-2 array containing the row and column indices of the cell the user edited in the running app. When a column is sorted, Indices returns the original 1-by-2 array of a cell before it was sorted—DisplayIndices returns the new location of the edited cell that displays visually in the sorted table. |
| DisplayIndices | This is a 1-by-2 array containing the row and column indices corresponding to the location of the edited cell in the display of the sorted table. If a user does not sort columns, then DisplayIndices has the same content as the Indices property. |
| PreviousData | This is the previous cell data. The default is an empty matrix, []. |
| EditData | This is the user-entered value. |
| NewData | This is the value that MATLAB wrote to the Data property array.The NewData property is empty if MATLAB detects an error in the user-entered data. |
| Error | This is the error message returned if MATLAB detects an error in the user-entered data.The Error property is empty when MATLAB successfully writes the value to the Data property.If the Error property is not empty, then the CellEditCallback can display the message, or it can attempt to fix the problem. |
| Source | Component executing the callback. |
| EventName | 'CellEdit'. |
When the user edits a table cell, MATLAB performs these steps:
- Tries to store the new value into the
Dataproperty of the table - Calls the
CellEditCallbackfunction (if it exists)
If the value results in an error and there is no CellEditCallback function, then the cell data reverts to its previous value and no error displays.
For more information about writing callbacks, see Callbacks in App Designer.
Location and size of the table, specified as a four-element vector of the form [left bottom width height]. This table describes each element in the vector.
| Element | Description |
|---|---|
| left | Distance from the inner left edge of the parent container to the outer left edge of the table |
| bottom | Distance from the inner bottom edge of the parent container to the outer bottom edge of the table |
| width | Distance between the right and left outer edges of the table |
| height | Distance between the top and bottom outer edges of the table |
All measurements are in units specified by theUnits property.
The Position values are relative to the_drawable area_ of the parent container. The drawable area is the area inside the borders of the container and does not include the area occupied by decorations such as a menu bar or title.
Units of measurement, specified as one of the values in this table.
| Units Value | Description |
|---|---|
| 'pixels' (default) | On Windows® and Macintosh systems, the size of a pixel is 1/96th of an inch. This size is independent of your system resolution.On Linux® systems, the size of a pixel is determined by your system resolution. |
| 'normalized' | These units are normalized with respect to the parent container. The lower-left corner of the container maps to (0,0) and the upper-right corner maps to(1,1). |
| 'inches' | Inches. |
| 'centimeters' | Centimeters. |
| 'points' | Points. One point equals 1/72nd of an inch. |
| 'characters' | These units are based on the default uicontrol font of the graphics root object:Character width = width of the letterx. Character height = distance between the baselines of two lines of text.To access the default uicontrol font, useget(groot,'defaultuicontrolFontName') orset(groot,'defaultuicontrolFontName'). |
The recommended value is 'pixels', because most MATLAB app building functionality measures distances in pixels. You can create a table that rescales based on the size of the parent container by parenting the table to a grid layout manager created using the uigridlayout function. For more information, see Lay Out Apps Programmatically.
Version History
Introduced in R2008a
When you add multiline data to a table, the component adjusts row heights to display the content. For example, this code creates a table that includes two lines of text in one cell. The height of the row with multiline content adjusts to display both lines of text.
fig = uifigure; t = uitable(uifigure, ... Data=["Omelette","Eggs";"Hamburger","Beef"+newline+"Bun"]);
These properties are available for tables in apps created using thefigure function:
DisplayDataColumnSortableSelectionDisplaySelectionSelectionTypeMultiselectStyleConfigurationsLayoutSelectionChangedFcnDisplayDataChangedFcnClickedFcnDoubleClickedFcn
When you query the Extent property of a table UI component in afigure-based app, the property always returns [0 0 300 300]. The third and fourth elements of the vector represent the default table width and height. In previous releases, queryingExtent returned a vector where the third and fourth elements represent the width and height of the rectangle outlining the table area, estimated using the table data, row heights, and column widths. If you use theExtent property to specify the position of UI components in your app, the table UI component might have a different size or the layout of your app might appear shifted.
Update your code to remove references to the table Extent property by using one of these alternatives:
- Lay out the table and other UI components by manually specifying the
Positionproperty. - Use a grid layout manager with a row height or column width of
'fit'to automatically scale your app layout based on the size of the table with its data.
When modifying table colors using the BackgroundColor property, you can specify colors as hexadecimal color codes or color names, in addition to RGB triplets.
Use the DisplaySelection property of the table to query the cells that are selected in the current table display. This property is useful when an app user has sorted or rearranged columns in the table and you want to know which cells are selected based on the app user's view of the data.
Use the ClickedFcn and DoubleClickedFcn callback properties to program a response to a user clicking and double-clicking the table UI component.
For more information, see Table.
Specify the ability to interactively rearrange table columns in an app by using the ColumnRearrangeable property. In a table UI component with the ColumnRearrangeable value set to 'on', rearrange table columns in the app by clicking and dragging the column header.
In App Designer and apps created using the uifigure function, you can program an app to respond when a user rearranges table columns by creating aDisplayDataChangedFcn callback function.
For more information, see Table.
Use properties to configure selection options for table UI components.
- Set and query the table selection using the
Selectionproperty. - Specify whether a user can select table cells, rows, or columns using the
SelectionTypeproperty. - Specify whether a user can select single or multiple table elements using the
Multiselectproperty. - Update your app whenever a user selects table data by specifying a
SelectionChangedFcncallback.
Selection options in table UI components are supported only in App Designer apps and in figures created with the uifigure function.
For more information, see Table.
Configure the column widths of table UI components in App Designer anduifigure-based apps.
- To specify a weighted variable width, set the
ColumnWidthproperty to a number paired with an'x'character (for example,'2x'). - To configure column widths to automatically adjust to column names and data, set the
ColumnWidthproperty to'fit'.