axtoolbarbtn - Add buttons to axes toolbar - MATLAB (original) (raw)
Add buttons to axes toolbar
Syntax
Description
`btn` = axtoolbarbtn([tb](#mw%5F462cc588-d1fb-473b-86ce-70a2466b2790)) adds a push button to the axes toolbar specified by tb and returns theToolbarPushButton object.
`btn` = axtoolbarbtn([tb](#mw%5F462cc588-d1fb-473b-86ce-70a2466b2790),[style](#mw%5F8a7b4c36-138b-4a3c-9c0d-ae0ce0f4c42a)) adds either a push button or a state button to the toolbar specified bytb and returns the button object. For a push button, set the style to'push'. For a state button with two states, set the style to'state'.
`btn` = axtoolbarbtn([tb](#mw%5F462cc588-d1fb-473b-86ce-70a2466b2790),[style](#mw%5F8a7b4c36-138b-4a3c-9c0d-ae0ce0f4c42a),[Name,Value](#namevaluepairarguments)) specifies button properties using one or more name-value pair arguments.
Examples
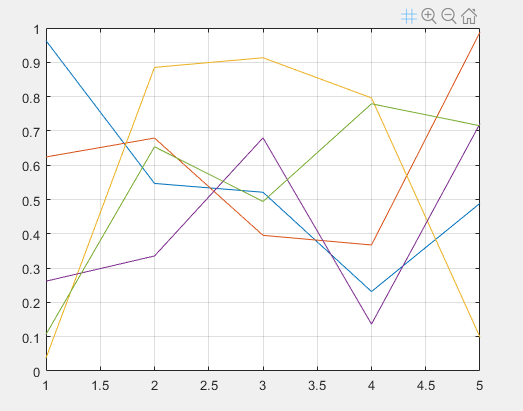
Add a custom state button for the axes toolbar that turns on and off the axes grid lines.
First, create a program file called mycustomstatebutton.m. Within the program file:
- Plot random data.
- Create a toolbar for the axes with options to zoom in, zoom out, and restore the view using the
axtoolbarfunction. - Add an empty state button to the toolbar using the
axtoolbarbtnfunction. Return theToolbarStateButtonobject. - Specify the icon, tool tip, and callback function for the state button by setting the
Icon,Tooltip, andValueChangedFcnproperties. This example uses the icon, which you must first save as an image file called
 mygridicon.pngon your path.
When you run the program file, click the icon to turn on and off the grid lines.
function mycustomstatebutton
plot(rand(5)) ax = gca; tb = axtoolbar(ax,{'zoomin','zoomout','restoreview'});
btn = axtoolbarbtn(tb,'state'); btn.Icon = 'mygridicon.png'; btn.Tooltip = 'Grid Lines'; btn.ValueChangedFcn = @customcallback;
function customcallback(src,event)
    switch src.Value
        case 'off'
            event.Axes.XGrid = 'off';
            event.Axes.YGrid = 'off';
            event.Axes.ZGrid = 'off';
        case 'on'
            event.Axes.XGrid = 'on';
            event.Axes.YGrid = 'on';
            event.Axes.ZGrid = 'on';
    end
end
end
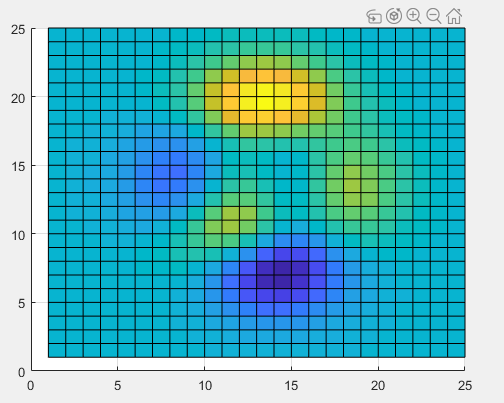
Create a custom push button for the axes toolbar that snaps the view of the axes to a 2-D view.
First, create a program file called mycustompushbutton.m. Within the program file:
- Plot a surface.
- Create a toolbar for the axes with options to zoom in, zoom out, rotate, and restore the view using the
axtoolbarfunction. - Add an empty push button to the toolbar using the
axtoolbarbtnfunction. Return theToolbarPushButtonobject. - Specify the icon, tool tip, and callback function for the push button by setting the
Icon,Tooltip, andButtonPushedFcnproperties, respectively. This example uses the icon, which you must first save as an image file called
 my2dicon.pngon your path.
When you run the program file, click the icon to snap the view of the axes to a 2-D view.
function mycustompushbutton
surf(peaks(25)) ax = gca; tb = axtoolbar(ax,{'zoomin','zoomout','rotate','restoreview'});
btn = axtoolbarbtn(tb,'push'); btn.Icon = 'my2dicon.png'; btn.Tooltip = 'Snap to 2-D view'; btn.ButtonPushedFcn = @customcallback;
function customcallback(src,event)
    view(event.Axes,2)
end
end
Input Arguments
Toolbar, specified as an AxesToolbar object. Create the toolbar using the axtoolbar function, such as tb = axestoolbar.
Button style, specified as one of these options.
| Style | Description |
|---|---|
| 'push' | Push button. When clicked once, the button appears to press and release. |
| 'state' | State button with two states. When clicked once, the button remains in the pressed or released state until it is clicked again. |
Name-Value Arguments
Specify optional pairs of arguments asName1=Value1,...,NameN=ValueN, where Name is the argument name and Value is the corresponding value. Name-value arguments must appear after other arguments, but the order of the pairs does not matter.
Before R2021a, use commas to separate each name and value, and enclose Name in quotes.
Example: axtoolbarbtn(tb,'push','Icon','myimage.png','Tooltip','My Icon Tooltip')
Button icon, specified as one of these values. The axes toolbar displays icons as grayscale images. MATLAB® scales down the image to fit, if necessary.
- File name — Specify the file name as a character vector or a string scalar. The file name can be preceded by a path. The image file must be in JPEG, GIF, or PNG format.
- Array — Specify an m-by-n-by-3 array of RGB triplets that represent pixels in an image.
- Matrix — Specify an m-by-n matrix of numeric values that represent pixels in an image.
- If the values are of an integer type, then specify values between
0and63. A value of0is opaque and a value of63is transparent.NaNis also transparent. - If the values are of type
double, then specify values between1and64. A value of1is opaque and a value of64is transparent.NaNis also transparent.
- If the values are of an integer type, then specify values between
- Predefined icon — Specify one of the names in this table.
Icon Name Result 'brush' 
'datacursor' 
'export' 
'rotate' 
'pan' 
'zoomin' 
'zoomout' 
'restoreview' 
'none' No icon
Example: btn.Icon = 'icon.png'
Example: btn.Icon = 'C:\Documents\icon.png'
Example: btn.Icon = 'rotate'
Button tool tip, specified as a character vector, cell array of character vectors, or a string array. Use this property to display a message when you hover the pointer over the button. To display multiple lines of text, specify a cell array of character vectors or a string array. Each element in the array displays a separate line of text.
Example: btn.Tooltip = 'My Tooltip'
Version History
Introduced in R2018b