barh - Horizontal bar graph - MATLAB (original) (raw)

Syntax
Description
barh([y](#mw%5F2ba578b0-464f-48e5-b86d-de37ba0a0b39)) creates a horizontal bar graph with one bar for each element in y. If y is an_m_-by-n matrix, then barh creates m groups of n bars.
barh([x](#mw%5F15a1a687-34cc-476f-80f1-8b6e684c94c7),[y](#mw%5F2ba578b0-464f-48e5-b86d-de37ba0a0b39)) draws the bars along the vertical axis at the locations specified by x.
barh(___,[width](#mw%5F3562ddae-090c-4ad4-805f-7acf42f74536)) specifies the fraction of available space occupied by each bar. For example, barh(y,1) makes the bars in each group touch each other. Specify width as the last argument in any of the previous syntaxes.
barh(___,[style](#mw%5F7e44570b-5f93-42ed-aa3e-ebd0cbff3b29)) specifies the style of the bar groups. For example, barh(y,'stacked') stacks the bars within each group into a multicolored bar.
barh(___,[color](#bszg5t5-1%5Fsep%5Fmw%5Fc58e1a8d-49a1-454e-9f85-f7df84158619)) specifies a single color for all the bars. For example, barh(y,'red') displays red bars.
barh(___,[Name,Value](#namevaluepairarguments)) specifies properties of the bar graph using one or more name-value pair arguments. Only bar graphs that use the default 'grouped' or 'stacked' style support setting bar properties. Specify the name-value pair arguments after all other input arguments. For a list of properties, see Bar Properties.
barh([ax](#mw%5Fc84377bd-944a-440b-964a-132a381f37b6),___) displays the bar graph in the target axes. Specify the axes as the first argument in any of the previous syntaxes.
[b](#mw%5F64189bab-c951-4abe-8ef8-54314cf5c36a) = barh(___) returns one or moreBar objects. If y is a vector, thenbarh returns one Bar object. Ify is a matrix, then barh returns a Bar object for each series. Use b to set properties of the bars after displaying the bar graph.
Examples
Create a vector of four values. Display the values in a bar graph with one horizontal bar for each value.
y = [10 20 30 41]; barh(y)

Define x as a matrix of three year values. Define y as a matrix containing snowfall data for four cities. Display the four series of bars in groups for each year. Then add the axis labels and a legend.
x = [1980 1990 2000]; y = [40 50 63 52; 42 55 50 48; 30 20 44 40]; barh(x,y) xlabel('Snowfall') ylabel('Year') legend({'Springfield','Fairview','Bristol','Jamesville'})

Since R2023b
Create a string vector x containing the names of four bars. Create a numeric vector y containing the lengths of the bars. Then create a bar chart of x and y.
x = ["Spring" "Summer" "Autumn" "Winter"]; y = [1 2 3 4]; barh(x,y)

Create matrix y. Then display the values of y in a bar graph with a baseline value of 25. Values that are less than 25 display on the left side of the baseline.
y = [8 15 33; 30 35 40; 50 55 62]; barh(y,'BaseValue',25)

Define x as a vector of three year values. Define y as a matrix that contains a combination of negative and positive values. Display the values in a stacked horizontal bar graph.
x = [1980 1990 2000]; y = [15 20 -5; 10 -17 21; -10 5 15]; barh(x,y,'stacked')

Define y as a vector of four values, and display the values in a horizontal bar graph. Then call the yticklabels function to change the tick labels on the vertical axis.
y = [10 20 30 41]; barh(y) yticklabels({'April','May','June','July'})

One way to indicate categories for your bars is to specify X as a categorical array. The barh function uses a sorted list of the categories, so the bars might display in a different order than you expect. To preserve the order, call the reordercats function.
Define X as categorical array, and call the reordercats function to specify the order for the bars. Then define Y as a vector of bar lengths and display the bar graph.
X = categorical({'Small','Medium','Large','Extra Large'}); X = reordercats(X,{'Small','Medium','Large','Extra Large'}); Y = [10 21 33 52]; barh(X,Y)

Since R2024b
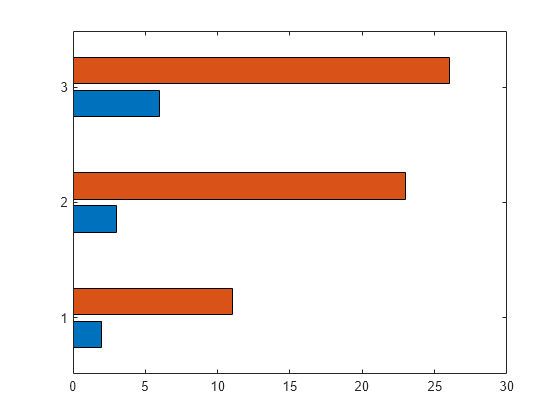
Create a matrix vals that contains two series of data. Display the data in a horizontal bar graph and specify an output argument. Because there are two series, barh returns a vector of two Bar objects.
x = [1 2 3]; vals = [2 3 6; 11 23 26]; b = barh(x,vals);

Display the bar values, stored in the YData property, at the tips of the first series of bars.
b(1).Labels = b(1).YData;

Then label the second series of bars in the same way.
b(2).Labels = b(2).YData;

As an alternative to using the Labels property to specify bar labels, you can use the text function to create the labels and position them using the XEndPoints and YEndPoints properties.
Create a matrix vals that contains two series of data. Display the data in a horizontal bar graph and specify an output argument. Because there are two series, barh returns a vector of two Bar objects.
x = [1 2 3]; vals = [2 3 6; 11 23 26]; b = barh(x,vals);
Display the bar values at the tips of the first series of bars. Get the coordinates of the tips of the bars by getting the XEndPoints and YEndPoints properties of the first Bar object. Because horizontal bar graphs have rotated axes, switch the values of XEndPoints and YEndPoints before passing them to the text function. Add a padding value of 0.3 to YEndpoints so that the text does not touch the edges of the bars. Then call the text function to display the labels.
xtips1 = b(1).YEndPoints + 0.3; ytips1 = b(1).XEndPoints; labels1 = string(b(1).YData); text(xtips1,ytips1,labels1,'VerticalAlignment','middle')

Next, follow the same steps to display the values at the tips of the second series of bars.
xtips2 = b(2).YEndPoints + 0.3; ytips2 = b(2).XEndPoints; labels2 = string(b(2).YData); text(xtips2,ytips2,labels2,'VerticalAlignment','middle')

Create and display data in a horizontal bar graph that has red bars with a thickness of 0.4.
y = [10 22 30 42]; width = 0.4; barh(y,width,'red');

Create matrix y in which each column is a series of data. Then display the data in a bar graph, specifying an output argument when calling the barh function. In this case, barh returns a vector of three Bar objects. Each object corresponds to a different series.
y = [10 15 20; 30 35 40; 50 55 62]; b = barh(y);

Modify the second series of bars to be green with thick red edges.
b(2).FaceColor = [.2 .6 .5]; b(2).EdgeColor = [.63 .08 .18]; b(2).LineWidth = 2;

Create and display data in two different bar graphs using the default 'grouped' style and the 'stacked' style.
x = [1980 1990 2000]; y = [8 15 25; 30 35 40; 50 55 62];
% Grouped tiledlayout(2,1); ax1 = nexttile; barh(ax1,x,y) title('Grouped Style')
% Stacked ax2 = nexttile; barh(ax2,x,y,'stacked') title('Stacked Style')

Input Arguments
Vertical axis coordinates, specified as a scalar, vector, matrix, string array, or cell array of character vectors. The values of x do not need to be in order.
If you specify x as a string array or cell array of character vectors, the values must be unique. MATLAB® stores the values as a categorical array, and the bars display in the order you specify.
This table describes some common ways to present your data.
| Presentation | How to Specify X and Y | Example |
|---|---|---|
| Display one series of bars. | Specify x and y as vectors that are the same length. The values in x must be unique, but the values in y do not need to be unique. | x = [1980 1990 2000]; y = [10 20 30]; barh(x,y) 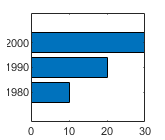 |
| Display multiple series of bars in groups. | Specify either of these combinations: Specify x and y as matrices of equal size. Each column of y corresponds to a series of bars. By default, each series is a different color. To ensure consistent placement of the groups, specify the columns ofx as identical vectors. The values within a column must be unique, even though the columns are repeated.Specify x as a vector of unique values, and specify y as a matrix. The length ofx must equal the length of at least one dimension of y. The other dimension of y contains values for the different series of bars. | x = [1980 1980 1980 1990 1990 1990]; y = [2 6 9 11 22 32]; barh(x,y) Orx = [1980 1990]; y = [2 6 9 11 22 32]; barh(x,y)  |
| Display one group of bars centered at one x value. | Specify x as a scalar and y as a vector. | x = 1990; y = [10 20 30]; barh(x,y)  |
Data Types: single | double | int8 | int16 | int32 | int64 | uint8 | uint16 | uint32 | uint64 | categorical | datetime | duration | string (since R2023b) | cell (since R2023b)
Bar lengths, specified as a scalar, vector, or matrix. The size ofy depends on the size of x and how you want to display your data. This table describes the most common situations.
| Presentation | How to Specify X and Y | Example |
|---|---|---|
| Display one series of bars. | Specify x and y as vectors that are the same length. The values in x must be unique, but the values in y do not need to be unique. | x = [1980 1990 2000]; y = [10 20 30]; barh(x,y) |
| Display multiple series of bars in groups. | Specify either of these combinations: Specify x and y as matrices of equal size. Each column of y corresponds to a series of bars. By default, each series is a different color. To ensure consistent placement of the groups, specify the columns ofx as identical vectors. The values within a column must be unique, even though the columns are repeated.Specify x as a vector of unique values, and specify y as a matrix. The length ofx must equal the length of at least one dimension of y. The other dimension of y contains values for the different series of bars. | x = [1980 1980 1980 1990 1990 1990]; y = [2 6 9 11 22 32]; barh(x,y) Orx = [1980 1990]; y = [2 6 9 11 22 32]; barh(x,y) |
| Display one group of bars centered at one x value. | Specify x as a scalar and y as a vector. | x = 1990; y = [10 20 30]; barh(x,y) |
Data Types: single | double | int8 | int16 | int32 | int64 | uint8 | uint16 | uint32 | uint64 | duration
Bar thickness, specified as a fraction of the total space available for each bar. The default of 0.8 means each bar uses 80% of the space from the previous bar to the next bar, with 10% of empty space on either side.
If the thickness is 1, then the bars within a group touch one another.
Example: barh([1 2 3],0.5) creates bars that use 50% of the available space.
Group style, specified by one of these values.
| Style | Result | Example |
|---|---|---|
| 'grouped' | Display each group as adjacent bars that are centered around the corresponding x value. | 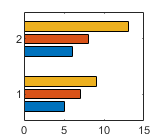 |
| 'stacked' | Display each group as one multicolored bar. The length of a bar is the sum of the elements in the group.If y is a vector, then the result is the same as'grouped'. | 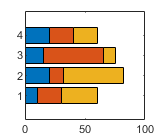 |
| 'histc' | Display the bars in histogram format, in which the bars in a group touch one another. The trailing edge of each group is aligned with the corresponding x value.NoteA better way to display a horizontal histogram is to call the histogram function and specify the Orientation name-value pair argument. |  |
| 'hist' | Display the bars in histogram format. Each group is centered at the corresponding x value.NoteA better way to display a horizontal histogram is to call the histogram function and specify the Orientation name-value pair argument. | 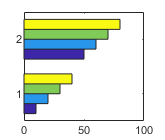 |
Bar color, specified as one of the options in this table.
| Color Name | Short Name | Appearance |
|---|---|---|
| 'red' | 'r' |  |
| 'green' | 'g' |  |
| 'blue' | 'b' |  |
| 'cyan' | 'c' |  |
| 'magenta' | 'm' |  |
| 'yellow' | 'y' |  |
| 'black' | 'k' |  |
| 'white' | 'w' |  |
Target axes, specified as an Axes object. If you do not specify the axes, then the bar graph displays in the current axes.
Name-Value Arguments
Specify optional pairs of arguments asName1=Value1,...,NameN=ValueN, where Name is the argument name and Value is the corresponding value. Name-value arguments must appear after other arguments, but the order of the pairs does not matter.
Before R2021a, use commas to separate each name and value, and enclose Name in quotes.
Example: barh([10 20 30],'EdgeColor','g') specifies a green outline around the bars.
Note
- The properties listed here are only a subset. For a complete list, seeBar Properties.
- You can set these properties only on bar graphs that use the default
'grouped'or'stacked'style.
Data Types: single | double | int8 | int16 | int32 | int64 | uint8 | uint16 | uint32 | uint64
Output Arguments
Bar objects. Use the elements inb to access and modify properties of a specific Bar object after it has been created. The number ofBar objects depends on the size of y. Ify is a vector, then b is one Bar object. If y is a matrix, thenb is a vector containing a Bar object for each series in y.
More About
A series consists of the bars at all locations in X for a particular set of data. By default, each series of bars is indicated by a different color.
A group consists of all the bars at a particular location inX.
Extended Capabilities
The barh function supports GPU array input with these usage notes and limitations:
- This function accepts GPU arrays, but does not run on a GPU.
For more information, see Run MATLAB Functions on a GPU (Parallel Computing Toolbox).
Version History
Introduced before R2006a
When you create a horizontal bar chart, you can specify the bar labels as a string vector or cell array of character vectors. The bar tick labels appear in the order you specify them.