bubblelegend - Create legend for bubble chart - MATLAB (original) (raw)
Create legend for bubble chart
Since R2020b
Syntax
Description
bubblelegend creates a bubble legend in the current axes. Bubble legends are useful for showing the relationship between the bubbles and the size data for charts you create with the bubblechart,bubblechart3, and polarbubblechart functions.
bubblelegend([titletext](#mw%5F7bf7f9b0-8d3d-4188-a152-b9d236f995da)) specifies a title for the legend. Specify titletext as a character vector, cell array of character vectors, or a string array.
bubblelegend(___,[Name,Value](#namevaluepairarguments)) sets bubble legend properties using one or more name-value pair arguments. Specify the properties after all other input arguments.
bubblelegend([ax](#mw%5F72564ed3-bf59-45c8-a088-9af204fbaa6f),___) creates the legend in the specified target axes ax. Specify the axes before all other input arguments.
blgd = bubblelegend(___) returns theBubbleLegend object. Use blgd to modify properties of the legend after creating it. For a list of properties, see BubbleLegend Properties.
Examples
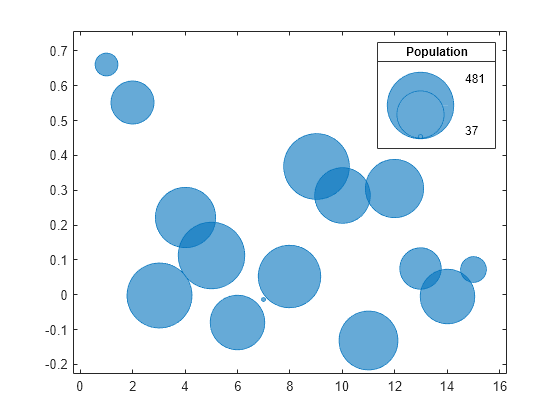
Create a bubble chart and add a bubble legend.
x = 1:10; y = exp(-0.5*x) + .05 * randn(1,10); sz = randi([20 500],[1,10]); bubblechart(x,y,sz) bubblelegend('Population')

Create a bubble chart and add a bubble legend. Specify the 'telescopic' style for a more compact presentation.
x = 1:15; y = exp(-0.5*x) + .1 * randn(1,15); sz = randi([20 500],[1,15]); bubblechart(x,y,sz) bubblelegend('Population','Style','telescopic');
Create a bubble chart. Then call the bubblelegend function with a return argument to store the BubbleLegend object as blgd. Move the legend outside the plot box by setting the Location property on the object to 'northeastoutside'. Display two bubbles instead of three by setting the NumBubbles property to 2.
x = 1:50; y = rand(1,50); sz = randi([20 500],[1,50]); bubblechart(x,y,sz)
% Create bubble legend and set properties blgd = bubblelegend('Population'); blgd.Location = 'northeastoutside'; blgd.NumBubbles = 2;

When you display multiple data sets with different colors or different types of plot objects, you can include multiple legends. To manage the alignment of the legends, create your chart in a tiled chart layout.
Create two sets of data, and plot them together in the same axes object within a tiled chart layout.
x = 1:20; y1 = rand(1,20); y2 = rand(1,20); sz1 = randi([20 500],[1,20]); sz2 = randi([20 500],[1,20]);
% Plot data in a tiled chart layout t = tiledlayout(1,1); nexttile bubblechart(x,y1,sz1) hold on bubblechart(x,y2,sz1) hold off
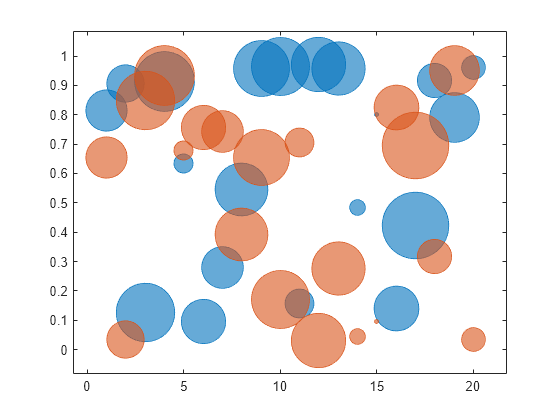
Add a bubble legend for illustrating the bubble sizes, and add another legend for illustrating the colors. Call the bubblelegend and legend functions using a return argument to store the legend objects. Move the legends to the east tile by setting the Layout.Tile property on each object to 'east'. Placing the legends together in a tile keeps them aligned.
blgd = bubblelegend('Population'); lgd = legend('Springfield','Fairview'); blgd.Layout.Tile = 'east'; lgd.Layout.Tile = 'east';

Input Arguments
Title text, specified as a character vector, cell array of character vectors, or string array. To create a multiline title, specify a cell array of character vectors or a string array.
Example: bubblelegend('My Legend')
Target axes, specified as an Axes, PolarAxes, or GeographicAxes object. If you do not specify the axes, MATLAB® plots into the current axes, or it creates an Axes object if one does not exist.
Name-Value Arguments
Specify optional pairs of arguments asName1=Value1,...,NameN=ValueN, where Name is the argument name and Value is the corresponding value. Name-value arguments must appear after other arguments, but the order of the pairs does not matter.
Before R2021a, use commas to separate each name and value, and enclose Name in quotes.
Example: bubblelegend('Style','telescopic') creates a telescopic legend.
Location with respect to the axes, specified as one of the location values listed in this table.
| Value | Description |
|---|---|
| 'north' | Inside top edge of the axes. |
| 'south' | Inside bottom edge of the axes. |
| 'east' | Inside right edge of the axes. |
| 'west' | Inside left edge of the axes. |
| 'northeast' | Inside top-right corner of the axes. |
| 'northwest' | Inside top-left corner of the axes. |
| 'southeast' | Inside bottom-right corner of the axes. |
| 'southwest' | Inside bottom-left corner of the axes. |
| 'northoutside' | Above the axes. |
| 'southoutside' | Below the axes. |
| 'eastoutside' | To the right of the axes. |
| 'westoutside' | To the left of the axes. |
| 'northeastoutside' | Outside top-right corner of the axes. |
| 'northwestoutside' | Outside top-left corner of the axes. |
| 'southeastoutside' | Outside bottom-right corner of the axes. |
| 'southwestoutside' | Outside bottom-left corner of the axes |
| 'layout' | A tile in a tiled chart layout. To move the legend to a different tile, set the Layout property. |
| 'none' | A location determined by the Position property. Use thePosition property to specify a custom location. |
Legend style, specified as one of the values from the table. The images in the table show how a legend with three bubbles looks with the different styles.
| Style Value | Appearance |
|---|---|
| 'vertical' |  |
| 'horizontal' |  |
| 'telescopic' |  |
Number of bubbles to display in the legend, specified as 2 or 3. This table shows how a vertical bubble legend looks with 2 and 3 bubbles.
| NumBubbles Value | Appearance |
|---|---|
| 2 |  |
| 3 | |
Limit labels, specified as a two- or three-element cell array of character vectors or string array. The first label appears next to the smallest bubble in the legend, and the last label appears next to the largest bubble. If you specify three labels, the second label does not display when the legend is horizontal or if the legend only has two bubbles. This table shows some common scenarios.
| Example | Result |
|---|---|
| Create a vertical legend with three bubbles, and specify three limit labels.blgd = bubblelegend; blgd.LimitLabels = {'Shortage','Abundance','Surplus'}; |  |
| Create a telescopic legend with three bubbles, and specify three limit labels.blgd = bubblelegend('Style','telescopic'); blgd.LimitLabels = {'Shortage','Abundance','Surplus'}; |  |
| Create a vertical legend with two bubbles, and specify three limit labels.blgd = bubblelegend('NumBubbles',2); blgd.LimitLabels = {'Shortage','Abundance','Surplus'}; | 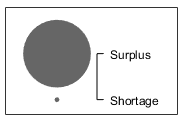 |
| Create a horizontal legend with three bubbles, and specify three limit labels.blgd = bubblelegend('Style','horizontal'); blgd.LimitLabels = {'Shortage','Abundance','Surplus'}; | 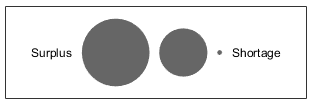 |
Order of the bubble sizes, specified as one of the values from the table. The table shows the effect of the different values on a vertical legend that has three bubbles.
| BubbleSizeOrder Value | Appearance |
|---|---|
| 'descending' | |
| 'ascending' | 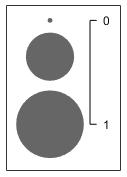 |
Version History
Introduced in R2020b