bubblesize - Set minimum and maximum bubble sizes in points - MATLAB (original) (raw)
Set minimum and maximum bubble sizes in points
Since R2020b
Syntax
Description
bubblesize([sizerange](#mw%5F498bbf7c-7736-455d-94ac-5b25cde27f3b)) sets the size of the smallest and largest bubble for bubble charts in the current axes. Specifysizerange as a two-element vector containing the smallest and largest diameters in points, where 1 point = 1/72 inch.
bubblesize([ax](#mw%5Fbf46c133-e4ea-4d9b-962c-abe979ab1642),[sizerange](#mw%5F498bbf7c-7736-455d-94ac-5b25cde27f3b)) sets the bubble sizes in the axes specified by ax.
sz = bubblesize returns the size range for the current axes as a two-element vector containing the diameters of the smallest and largest bubbles in points.
`sz` = bubblesize([ax](#mw%5Fbf46c133-e4ea-4d9b-962c-abe979ab1642)) returns the size range for the axes specified by ax.
Examples
Create a bubble chart with a legend.
x = 1:10; y = [4 7 10 7 3 6 5 1 9 7]; sz = [5 1 14 6 9 12 15 20 8 2]; bubblechart(x,y,sz); bubblelegend('Population','Location','northeastoutside')
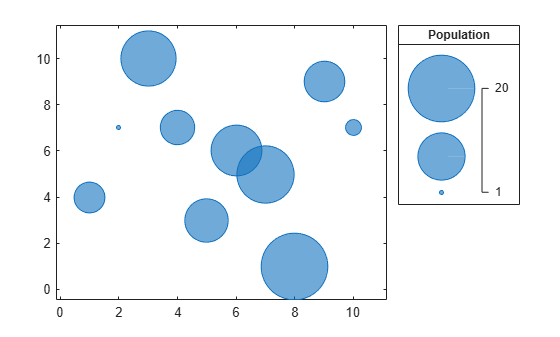
Get the current range of bubble sizes.
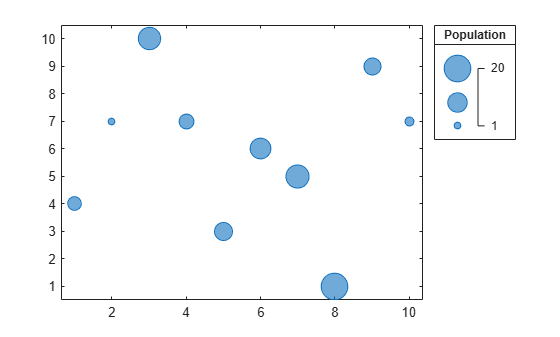
Change the bubble sizes so that they are between 5 and 20 points in diameter. The bubble legend automatically updates to reflect the new bubble sizes.
Create two sets of data, then create a tiled chart layout containing two bubble charts.
% Create two sets of data x1 = 1:10; x2 = 1:50; y1 = rand(1,10); y2 = rand(1,50); sz1 = randperm(10,10); sz2 = randperm(50,50);
% Create tiled chart layout t = tiledlayout(1,2);
% Create bubble chart in first tile ax1 = nexttile; bubblechart(x1,y1,sz1)
% Create bubble chart in first tile ax2 = nexttile; bubblechart(x2,y2,sz2)
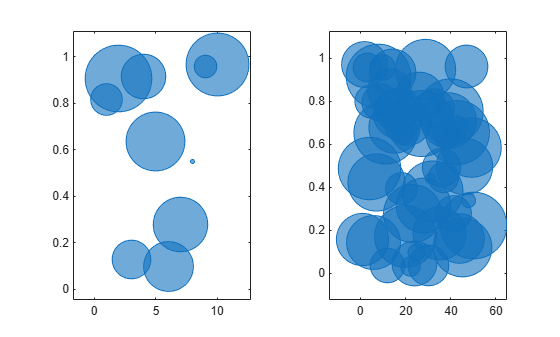
Query the range of bubble sizes in the right chart by passing ax2 to the bubblesize function.
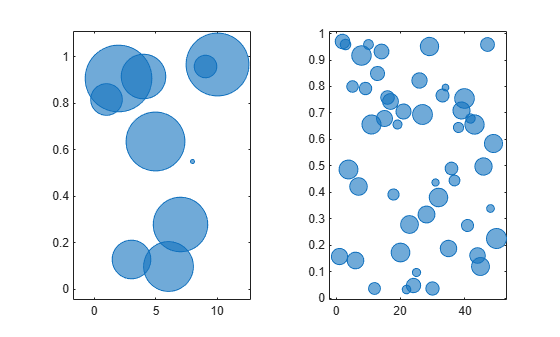
Change the bubble sizes in the right chart so that they range between 5 and 15 points in diameter.
Input Arguments
Size range, specified as a two-element vector containing positive numbers, where the second number is greater than the first. The numbers specify the smallest and largest bubble sizes in points, where 1 point = 1/72 inch.
By default, bubble charts use a size range of [3 50].
Example: bubblesize([20 70]) sets the smallest bubble size to 20 points and the largest bubble size to 70 points.
Target axes, specified as an Axes, PolarAxes, or GeographicAxes object.
Version History
Introduced in R2020b