clim - Set colormap limits (Renamed from caxis in R2022a) - MATLAB (original) (raw)
Main Content
Set colormap limits (Renamed from caxis in R2022a)
Syntax
Description
clim([limits](#mw%5Fab1487c8-86fa-48ed-867a-22fa7aaea921)) sets the colormap limits for the current axes. limits is a two-element vector of the form [cmin cmax]. All values in the colormap indexing array that are less than or equal to cmin map to the first row in the colormap. All values that are greater than or equal tocmax map to the last row in the colormap. All values betweencmin and cmax map linearly to the intermediate rows of the colormap.
Note
The clim function only affects graphics objects that have theCDataMapping property set to "scaled". It does not affect graphics objects that use truecolor or have theCDataMapping set to "direct".
clim("auto") enables automatic limit updates when values in the colormap indexing array change. This is the default behavior. The clim auto command is an alternative form of this syntax.
clim("manual") disables automatic limit updates. The clim manual command is an alternative form of this syntax.
clim([target](#mw%5F99dde135-4b98-4b0e-ad0b-c954f2b0c7c3),___) sets the colormap limits for a specific axes or standalone visualization. Specify target as the first input argument in any of the previous syntaxes.
lims = clim returns the current colormap limits as a vector of the form [cmin cmax].
Examples
Plot a paraboloid with a colorbar.
[X,Y] = meshgrid(-5:.5:5); Z = X.^2 + Y.^2; surf(Z); colorbar

Get the current color limits.
Raise the lower limit to 20. Notice that all values of Z that are less than or equal to 20 map to the first color.

Create two paraboloid surfaces that are vertically offset.
[X,Y] = meshgrid(-5:.5:5); Z1 = X.^2 + Y.^2; Z2 = Z1 + 50;
Plot the first paraboloid. Add a colorbar, and hold the axes for the second paraboloid.
surf(X,Y,Z1); colorbar hold on

Hold the current color limits using the "manual" option. Then plot the second paraboloid.
clim("manual"); surf(X,Y,Z2);

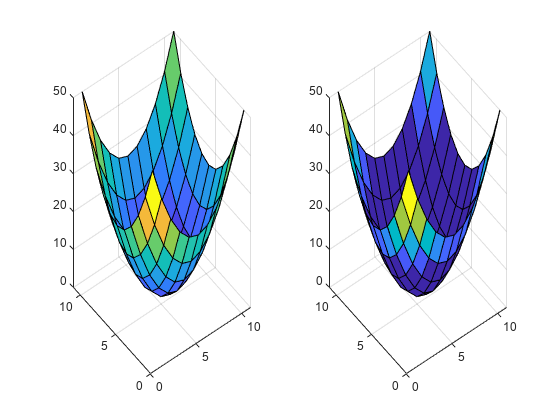
Call the tiledlayout function to create a 1-by-2 tiled chart layout. Call the nexttile function to create the axes objects ax1 and ax2. Plot a paraboloid into each axes.
[X,Y] = meshgrid(-5:1:5); Z = X.^2 + Y.^2; tiledlayout(1,2)
% Left plot ax1 = nexttile; surf(ax1,Z);
% Right plot ax2 = nexttile; surf(ax2,Z);

Raise the lower color limit of the right axes to 20.
Input Arguments
New limits, specified as a vector of the form [cmin cmax]. The value of cmin must be less than cmax.
Data Types: single | double
Target object, specified as one of these items:
- Any type of axes object, such as an
Axes,PolarAxes, orGeographicAxesobject. - A standalone visualization that has a
Colormapproperty. - An array of axes or standalone visualizations that belong to the same class. To determine the class, use the class function.
If you do not specify the target object, then clim sets the colormap limits for the current axes (gca).
More About
An array that maps data elements in a chart to specific rows in the colormap. MATLAB® stores the indexing array as a property on the graphics object.
For example, the CData property of a Surface object is an indexing array that maps grid points on the surface to specific rows in the colormap.
Version History
Introduced before R2006a
Set the colormap limits for multiple axes or charts at once by specifying thetarget argument as an array of axes or standalone visualizations.
To align the function name with the CLim axes property,caxis is now called clim.