copyobj - Copy graphics objects and their children - MATLAB (original) (raw)
Copy graphics objects and their children
Syntax
Description
[newobj](#mw%5F727c6369-2f73-41af-ad37-4ae09d6e6cc1) = copyobj([obj](#mw%5Fea605427-b386-42dd-b1ed-024798656801),[parent](#mw%5F3cc0f3ac-a2e1-4d5e-9961-e5eafaecd436)) creates a copy of the specified graphics object, assigns it to the specified new parent, and returns the new object. If obj has children,copyobj copies them as well.
copyobj does not copy properties or child objects that depend on their original context, including callback properties or any application data associated with the original object. For more information, see What Is Not Copied.
[newobj](#mw%5F727c6369-2f73-41af-ad37-4ae09d6e6cc1) = copyobj([obj](#mw%5Fea605427-b386-42dd-b1ed-024798656801),[parent](#mw%5F3cc0f3ac-a2e1-4d5e-9961-e5eafaecd436),"legacy") additionally copies the object callback properties and object application data. This behavior is consistent with copyobj functionality before R2014b.
Examples
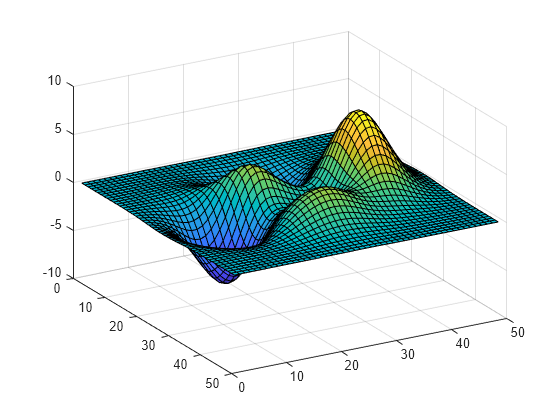
Copy a surface object to new axes in a different figure to view the plot from two angles simultaneously.
Create a surface object.

Create a new figure and axes. Then, create a copy of the surface object and assign it to the new axes. Change the view of the new plot by setting the line of sight of the camera to an azimuth of 60 degrees and an elevation of 30 degrees. Turn the grid on to match the original figure configuration, which is not copied with the surface object.
fig = figure; ax = axes; newobj = copyobj(obj,ax); view(ax,60,30) grid(ax,"on")
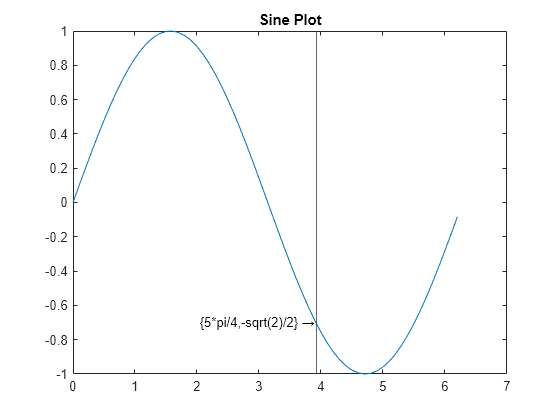
Create a set of similar plots, and label the same data point on each plot by copying a text object and a line marker object from the first plot to each of the other plots.
Create the first plot, and label it using a text object and a line marker object.
x = 0:.1:2pi; y = sin(x); plot(x,y) title("Sine Plot") t = text(5pi/4, -sqrt(2)/2, "{5pi/4,-sqrt(2)/2}\rightarrow", ... "HorizontalAlignment","right"); lm = xline(5pi/4);
Create a second plot without labels, and copy the text and line marker objects (t and lm) to the plot by assigning them to the new axes. Return the text and line marker object copies.
figure x = pi/4:.1:9*pi/4; plot(x,cos(x)) title("Cosine Plot") ax2 = gca; ax2.Color = [0.902 0.902 0.902]; % light gray lbl2 = copyobj([t,lm],ax2);

Copy the objects from several figures into one figure that uses a tiled chart layout.
Create the first figure containing a sine plot.
f1 = figure; ax1 = axes(f1); plot(ax1,sin(1:10))

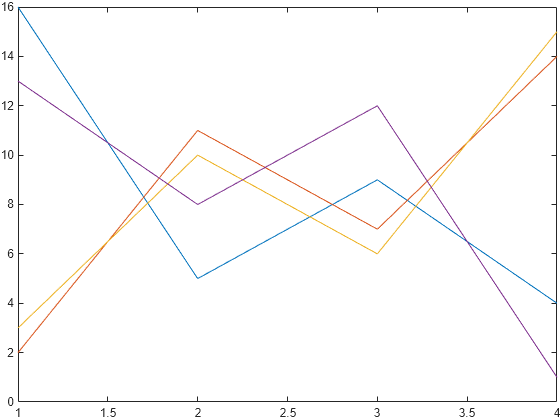
Create the second figure containing four plotted lines and a legend.
f2 = figure; ax2 = axes(f2); plot(ax2,magic(4)); lgd = legend(ax2);

Create a third figure with a tiled chart layout, and copy the plots and legend from the first and second figures into the tiles in the third figure.
f3 = figure; t = tiledlayout(f3,2,1);
ax1c = copyobj(ax1,t); ax2c = copyobj([ax2,lgd],t); ax1c(1).Layout.Tile = 1; ax2c(1).Layout.Tile = 2;

Copy the objects from different tiles in a tiled chart layout into multiple figures.
Create a figure containing a 2-by-1 tiled chart layout with two plots. The first tile contains a sine plot, and the second tile contains four plotted lines.
f = figure; t = tiledlayout(f,2,1);
ax1 = nexttile(t); plot(ax1,sin(1:10))
ax2 = nexttile(t); plot(ax2,magic(4))

Create a new figure, and copy the axes from the first tile into the new figure. To allow the axes to fill the entire figure, reset the position of the axes back to the default value.
f1 = figure; ax1c = copyobj(ax1,f1); set(ax1c,"OuterPosition","default");

Create another new figure, and copy the axes from the second tile into the new figure. To allow the axes to fill the entire figure, reset the position of the axes back to the default value.
f2 = figure; ax2c = copyobj(ax2,f2); set(ax2c,"OuterPosition","default")
Copy a panel containing multiple user interface controls from one figure to another.
Create a figure and a panel positioned within it. Then, create two radio buttons within the panel and set their values.
f1 = figure; p1 = uipanel(f1,"Position",[0.1 0.1 0.35 0.65]); rb1 = uicontrol(p1,"Style","radiobutton","String","Option 1", ... "Position",[10 50 100 22]); rb2 = uicontrol(p1,"Style","radiobutton","String","Option 2", ... "Position",[10 28 100 22]); p1.Children(1).Value = 0; p1.Children(2).Value = 1;

Create a new figure with a darker background, and copy the panel from the first figure into the second figure. Then, change the values of the radio buttons in the second figure.
f2 = figure; f2.Color = [0.902 0.902 0.902]; p2 = copyobj(p1,f2); p2.Children(1).Value = 1; p2.Children(2).Value = 0;

Input Arguments
Graphics object to copy, specified as a single object or a vector of objects.
Note
You cannot copy the same object more than once to the same parent in a single call to copyobj.
Parent of copied object, specified as a single object or a vector of objects. The parent must be appropriate for the copied object. For example, you can copy a line into axes, but not into a figure or panel.
Output Arguments
Copy of graphics object, returned as a single object or a vector of objects.
- If
objis a single object andparentis a single object,newobjis a single object. - If
objis a single object andparentis a vector of objects,newobjis a vector of objects. Eachnewobj(i)is a copy ofobjassigned to the parentparent(i). The length ofnewobjequals the length ofparent. - If
objis a vector of objects andparentis a single object,newobjis a vector of objects. Eachnewobj(i)is a copy ofobj(i)assigned to the parentparent. The length ofnewobjequals the length ofobj. - If both
objandparentare vectors of objects, they must be the same length, andnewobjis a vector of objects of the same length. Eachnewobj(i)is a copy ofobj(i)assigned to the parentparent(i).
The copied object is different from the original object. Therefore,== returns false when comparing the two objects. For more information, see What Is Not Copied.
More About
When creating a copy of a graphics object, copyobj does not copy properties or child objects that depend on their original context. If an object has default context menus (like as legends and colorbars have), then the copied object gets new context menus. Copies of figures get new toolbars and menus.
copyobj does not copy:
- Callback properties (except when using the
"legacy"option) - Application data associated with the object (except when using the
"legacy"option) - Context menu of legends, colorbars, or other objects that define default context menus
- Default figure toolbar and menus
- Axes objects used with the yyaxis function
- The
Interactionsproperty of an axes object - The
DataTipTemplateproperty for objects that have this property, such asLine,Scatter, andSurfaceobjects
Tips
- When copying a legend or a colorbar, you must also copy the associated axes.
- When building a user interface, do not call
copyobjor textwrap (which callscopyobj) inside a creation function. Copying a user interface control object calls the creation function repeatedly, exceeding the recursion limit and therefore causing an error.
Version History
Introduced before R2006a