figure - Create figure window - MATLAB (original) (raw)
Syntax
Description
figure creates a new figure window using default property values. The resulting figure is the current figure.
figure([Name,Value](#namevaluepairarguments)) modifies properties of the figure using one or more name-value pair arguments. For example, figure('Color','white') sets the background color to white.
[f](#buich1u-1-f) = figure(___) returns the Figure object. Use f to query or modify properties of the figure after it is created.
figure([f](#buich1u-1-f)) makes the figure specified by f the current figure and displays it on top of all other figures.
figure([n](#buich1u-1-n)) finds a figure in which the Number property is equal to n, and makes it the current figure. If no figure exists with that property value, MATLAB® creates a new figure and sets its Number property to n.
Examples
Create a default figure. The figure appears as a tab in a figure container.

Get the location, width, and height of the figure.
This means that the figure is positioned with its bottom left corner adjacent to the corner of the figure container, and the figure is 1070 pixels wide and 620 pixels tall.
You can resize the figure container interactively. Alternatively, you can specify the figure size by setting its Position property, which undocks the figure from the figure container. For example, position the figure to be 100 pixels to the right and 200 pixels above the bottom left corner of the primary display, and specify its size to be 500 pixels wide and 300 pixels tall.
f.Position = [100 200 500 300];

Create a figure, and specify the Name property. By default, the resulting title includes the figure number.
figure(Name="Measured Data");

Specify the Name property again, but this time, set the NumberTitle property to "off". The resulting title does not include the figure number.
figure(Name="Measured Data",NumberTitle="off");

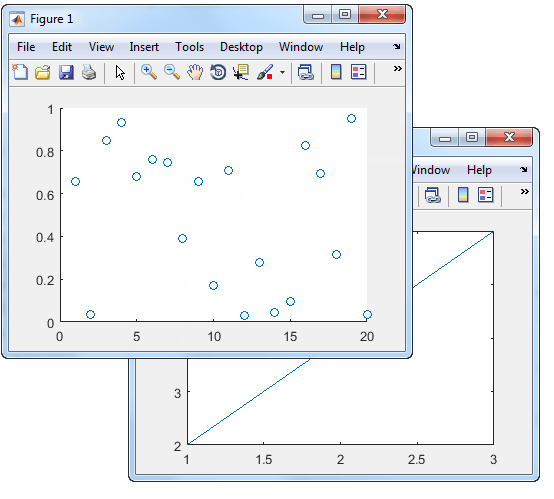
Create two figures, and then create a line plot. The figures appear as tabs in a figure container. By default, the plot command targets the current figure.
f1 = figure; f2 = figure; plot([1 2 3],[2 4 6]);

Set the current figure to f1, so that it is the target for the next plot. Then create a scatter plot.
figure(f1); scatter((1:20),rand(1,20));
Input Arguments
Target figure, specified as a Figure object.
Target figure number, specified as a scalar integer value. When you specify this argument, MATLAB searches for an existing figure in which the Number property is equal to n. If no figure exists with that property value, MATLAB creates a new figure and sets its Number property to n. By default, theNumber property value is displayed in the title of the figure.
Data Types: double
Name-Value Arguments
Specify optional pairs of arguments asName1=Value1,...,NameN=ValueN, where Name is the argument name and Value is the corresponding value. Name-value arguments must appear after other arguments, but the order of the pairs does not matter.
Example: figure(Color="white") creates a figure with a white background.
Before R2021a, use commas to separate each name and value, and enclose Name in quotes.
Example: figure("Color","white") creates a figure with a white background.
Note
The properties listed here are only a subset. For a full list, see Figure.
Data Types: double | char
Location and size of the figure, excluding borders, figure tools, and title bar, specified as a four-element vector of the form [left bottom width height].
This table describes each element in the vector.
| Element | Description |
|---|---|
| left | Distance from the left edge of the primary display to the inner left edge of the window. This value can be negative on systems that have more than one monitor.If the figure is docked, then this value is relative to its container. |
| bottom | Distance from the bottom edge of the primary display to the inner bottom edge of the window. This value can be negative on systems that have more than one monitor.If the figure is docked, then this value is relative to its container. |
| width | Distance between the right and left inner edges of the window. |
| height | Distance between the top and bottom inner edges of the window. |
All measurements are in units specified by theUnits property.
For figures that are docked into a figure container, setting thePosition property undocks the figure and sets the WindowStyle property to'normal'.
To position the full window, including the borders, figure tools, and title bar, use the OuterPosition property.
Note
The Windows® operating system enforces a minimum window width and a maximum window size. If you specify a figure size outside of those limits, the displayed figure conforms to the limits instead of the size you specified.
More About
The current figure is the target for graphics commands such as axes and colormap. Typically, it is the last figure created or the last figure clicked with the mouse. The gcf command returns the current figure.
Tips
- Use the graphics root object to set default values on the root level for other types of objects. For example, set the default colormap for all future figures to the
summercolormap.
set(groot,'DefaultFigureColormap',summer)
To restore a property to its original MATLAB default, use the'remove'keyword.
set(groot,'DefaultFigureColormap','remove')
For more information on setting default values, see Default Property Values.
Version History
Introduced before R2006a