findall - Find all graphics objects - MATLAB (original) (raw)
Find all graphics objects
Syntax
Description
h = findall([objhandles](#mw%5Ff992d3c9-2930-4b29-9740-88d62d7b403d)) returns the graphics objects in objhandles and all of their descendants. Unlike the findobj function, findall returns objects even if theirHandleVisibility property is set to 'off'.
h = findall([objhandles](#mw%5Ff992d3c9-2930-4b29-9740-88d62d7b403d),[prop](#mw%5Fc2f01be9-911f-41a3-ac4a-c2fc6de07a8c)1,[value](#mw%5F19d6fec0-71f3-4acc-98b3-fe688c141c06)1,...,[prop](#mw%5Fc2f01be9-911f-41a3-ac4a-c2fc6de07a8c)N,[value](#mw%5F19d6fec0-71f3-4acc-98b3-fe688c141c06)N) returns the handles of all objects in the hierarchy that have the specified properties set to the specified values. For example, h = findall(gcf,'Type','text','Color','r') returns all text objects in the current figure that have a red color.
Examples
Create three figures. Set the HandleVisibility property of the last figure to 'off'.
f1 = figure; f2 = figure; f3 = figure('HandleVisibility','off');
Display the number of visible or hidden handles in the graphics object hierarchy. Your result might be different from the result shown.
h1 = findall(groot); disp(numel(h1))
Find all visible or hidden figures.
h2 = findall(groot,'Type','figure')
h2 = 3×1 Figure array:
Figure (3) Figure (2) Figure (1)
If you try to find the figures using the findobj function, MATLAB® returns only f1 and f2.
h3 = findobj('Type','figure')
h3 = 2×1 Figure array:
Figure (2) Figure (1)
Text objects within a figure have hidden handles. Use findall to return these hidden handles.
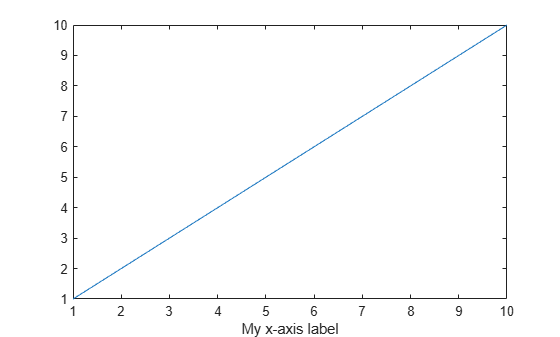
Create a figure with a plot. Then, create a label for the _x_-axis.
plot(1:10) txt = xlabel('My x-axis label');
Verify that the HandleVisibility property on txt is set to 'off'.
Use findall to return the Text object for the _x_-axis label.
h1 = findall(gcf,'Type','text')
h1 = Text (My x-axis label) with properties:
             String: 'My x-axis label'
           FontSize: 11
         FontWeight: 'normal'
           FontName: 'Helvetica'
              Color: [0.1294 0.1294 0.1294]
HorizontalAlignment: 'center'
           Position: [5.5000 0.2390 -1.0000]
              Units: 'data'
Show all properties
Because the Text object is hidden, you cannot find it using the findobj function.
h2 = findobj(gcf,'Type','text')
h2 = 0×0 empty GraphicsPlaceholder array.
Use findall to return all Text objects or Text objects with specific properties.
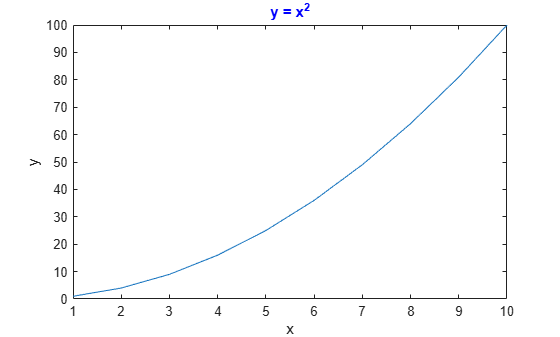
Create a figure with a plot. Then, label the axes and add a title to the axes. Set the color of the title to blue.
plot((1:10).^2) xlabel('x') ylabel('y') title('y = x^2','Color','b')
Return all Text objects in the current figure.
h1 = findall(gcf,'Type','text')
h1 = 3×1 Text array:
Text (y = x^2) Text (x) Text (y)
Now, return all blue Text objects.
h2 = findall(gcf,'Type','text','Color','b')
h2 = Text (y = x^2) with properties:
             String: 'y = x^2'
           FontSize: 11
         FontWeight: 'bold'
           FontName: 'Helvetica'
              Color: [0 0 1]
HorizontalAlignment: 'center'
           Position: [5.5000 101.0110 0]
              Units: 'data'
Show all properties
Input Arguments
Objects to search from, specified as an array of graphics objects.findall searches the objects in the input arrayobjhandles and all of their descendants in the graphics object hierarchy.
Example: h = findall(groot) returns all visible and hidden handles in the graphics object hierarchy.
Property name, specified as a character vector or string scalar. For more information, see Graphics Object Properties.
Example: h = findall(gcf,'Type','text') returns all objects in the current figure whose Type property is set to'text'.
Property value, specified as a scalar or array.
Tips
- To customize your search with
findall, you can useobjhandles followed by the input combinations from the findobj function. For example:
h = findall(groot,prop1,value1,'-not',prop2,value2,'-property',prop3)
Version History
Introduced before R2006a