Find Local Extrema - Find local maxima and minima in the Live Editor - MATLAB (original) (raw)
Main Content
Find local maxima and minima in the Live Editor
Description
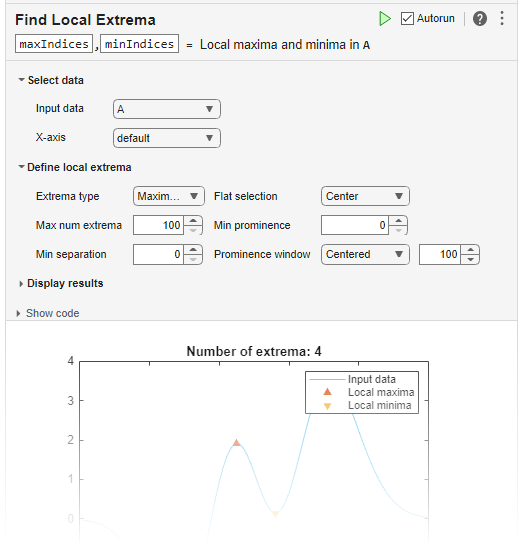
The Find Local Extrema task lets you interactively find local maxima and local minima in data. The task automatically generates MATLAB® code for your live script.
Using this task, you can:
- Find local maxima, minima, or both in data from a workspace variable.
- Adjust parameters to locate fewer or more extrema.
- Visualize the detected extrema.
Related Functions
Find Local Extrema generates code that uses theislocalmin andislocalmax functions.
Open the Task
To add the Find Local Extrema task to a live script in the MATLAB Editor:
- On the Live Editor tab, select > .
- In a code block in the script, type a relevant keyword, such as
extrema,find,islocalmin, ormax. SelectFind Local Extremafrom the suggested command completions. For some keywords, the task automatically updates one or more corresponding parameters.
Examples
Interactively find local minima in a vector of data using the Find Local Extrema task in the Live Editor.
Create a vector of data relative to the timestamps in the vector t.
t = hours(linspace(0,3,15)); data = [2 4 6 4 3 7 5 6 5 10 4 -1 -3 -2 0];
Open the Find Local Extrema task in the Live Editor. Select data as the input data and t as the _x_-axis coordinates of the data.
Specify the extrema type as Minima in the Extrema type field. Then, specify the minimum separation between local minima as 0.5 hours and the prominence window as 1 hour using the Min separation field, the Prominence window field, and the units drop-down.
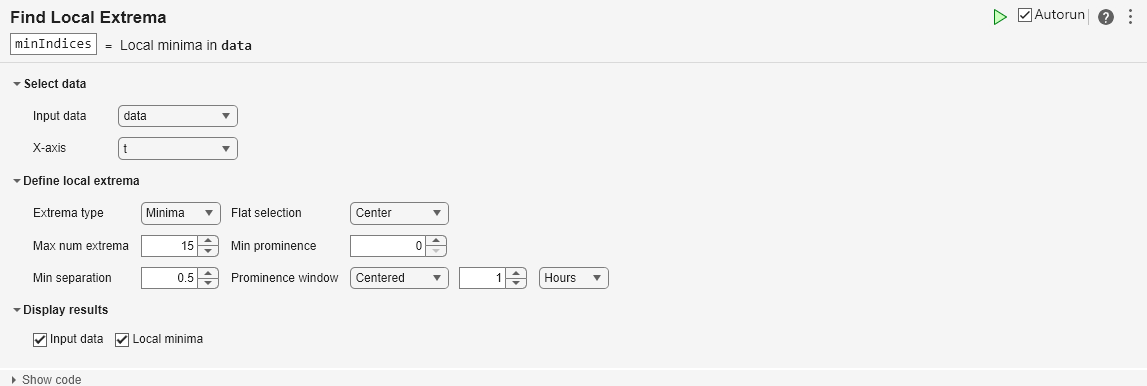
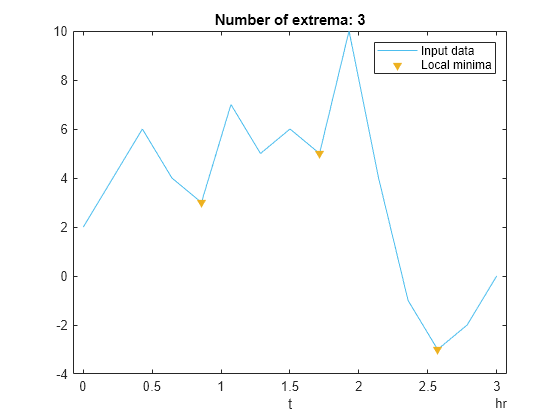
The title of the plot indicates that there are three local minima in data that are at least 0.5 hours apart.
You can use the output arguments of a Live Editor task in subsequent code. Use the indices returned by the task to determine the values of the local minima.
Related Examples
Parameters
This task operates on input data contained in a vector, table, or timetable. The data can be of type single, double,logical, or signed or unsigned integer types such asint64.
When providing a table or timetable for the input data, select All supported variables to operate on all variables with a supported type. Select All numeric variables to operate on all variables of type single or double, or signed or unsigned integer types. To choose specific supported variables to operate on, selectSpecified variables and then select the variables individually.
Specify a flat region indicator when you have local consecutive extrema values.
| Method | Description |
|---|---|
| Center | Indicates only the center element of a flat region as the local extrema |
| First | Indicates only the first element of a flat region as the local extrema |
| Last | Indicates only the last element of a flat region as the local extrema |
| All | Indicates all the elements of a flat region as the local extrema |
Specify a minimum prominence to return only local extrema whose prominence is at least that value. Higher prominence values return fewer detected extrema.
The prominence of a local maximum (or peak) is a measure of how the peak stands out with respect to its height and location relative to other peaks. The prominence of a local minimum (or valley) is a measure of how the valley stands out with respect to its depth and location relative to other valleys.
Specify a prominence window type and size to define a window of neighboring points for which to compute the prominence for each local extrema.
| Window | Description |
|---|---|
| Centered | Specified window length centered about the current point |
| Asymmetric | Specified window containing the number of elements before the current point and the number of elements after the current point |
Window sizes are relative to the X-axis variable units.
Version History
Introduced in R2019b
Simultaneously plot multiple table variables in the display of this Live Editor task. For table or timetable data, to visualize all selected table variables at once in a tiled chart layout, set the field.
Output a table or timetable with logical variables corresponding to the table variables checked for local extrema, or append the logical variables to the input table. For table or timetable input data, to specify the tabular format, set the field.
This Live Editor task does not run automatically if the inputs have more than 1 million elements. In previous releases, the task always ran automatically for inputs of any size. If the inputs have a large number of elements, then the code generated by this task can take a noticeable amount of time to run (more than a few seconds).
When a task does not run automatically, the Autorun indicator is disabled. You can either run the task manually when needed or choose to enable the task to run automatically.
This Live Editor task can operate on multiple table variables at the same time. For table or timetable input data, to operate on multiple variables, select All supported variables or Specified variables. Return all of the variables or only the modified variables, and specify which variable to visualize.