islocalmin - Find local minima - MATLAB (original) (raw)
Syntax
Description
[TF](#d126e929957) = islocalmin([A](#d126e929262)) returns a logical array whose elements are 1 (true) when a local minimum is detected in the corresponding element of A.
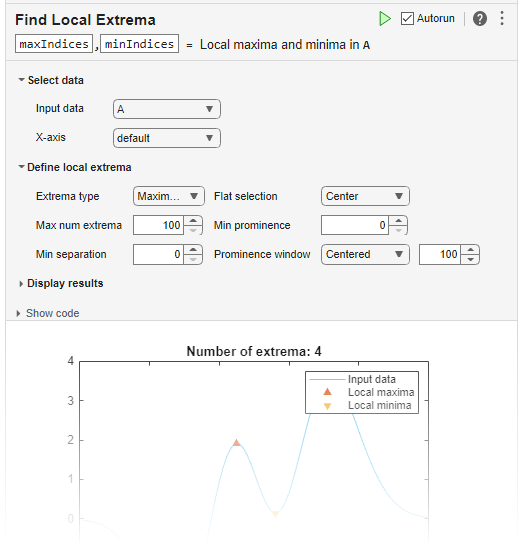
You can use islocalmin functionality interactively by adding the Find Local Extrema task to a live script.
[TF](#d126e929957) = islocalmin([A](#d126e929262),[dim](#d126e929287)) specifies the dimension of A to operate along. For example,islocalmin(A,2) finds the local minimum of each row of a matrix A.
[TF](#d126e929957) = islocalmin(___,[Name,Value](#namevaluepairarguments)) specifies parameters in addition to any of the input argument combinations in previous syntaxes for finding local minima using one or more name-value arguments. For example, islocalmin(A,'SamplePoints',t) finds local minima ofA with respect to the time stamps contained in the time vector t.
[[TF](#d126e929957),[P](#d126e930006)] = islocalmin(___) also returns the prominence corresponding to each element of A.
Examples
Compute and plot the local minima of a vector of data.
x = 1:100; A = (1-cos(2pi0.01x)).sin(2pi0.15x); TF = islocalmin(A); plot(x,A,x(TF),A(TF),'r')

Create a matrix of data, and compute the local minima for each row.
A = -25*diag(ones(5,1)) + rand(5,5); TF = islocalmin(A,2)
TF = 5×5 logical array
0 0 0 1 0 0 1 0 0 0 0 0 1 0 0 0 0 0 1 0 0 0 1 0 0
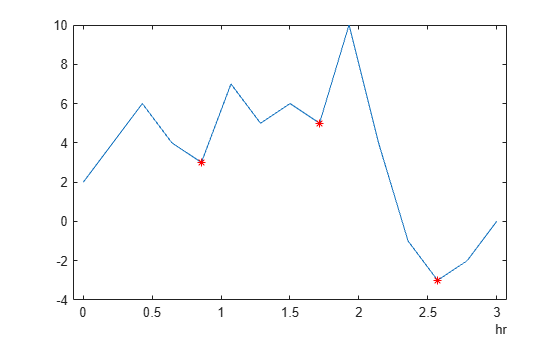
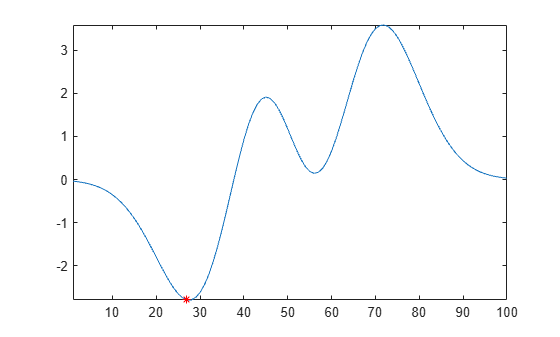
Compute the local minima of a vector of data relative to the time stamps in the vector t. Use the MinSeparation parameter to compute minima that are at least 45 minutes apart.
t = hours(linspace(0,3,15)); A = [2 4 6 4 3 7 5 6 5 10 4 -1 -3 -2 0]; TF = islocalmin(A,'MinSeparation',minutes(45),'SamplePoints',t); plot(t,A,t(TF),A(TF),'r*')
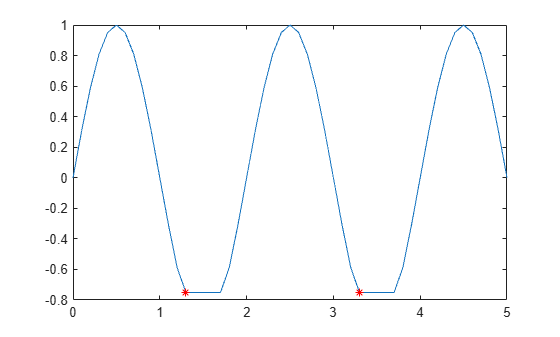
Specify a method for indicating consecutive minima values.
Compute the local minima of data that contains consecutive minima values. Indicate the minimum of each flat region based on the first occurrence of that value.
x = 0:0.1:5; A = max(-0.75, sin(pix)); TF1 = islocalmin(A,'FlatSelection','first'); plot(x,A,x(TF1),A(TF1),'r')
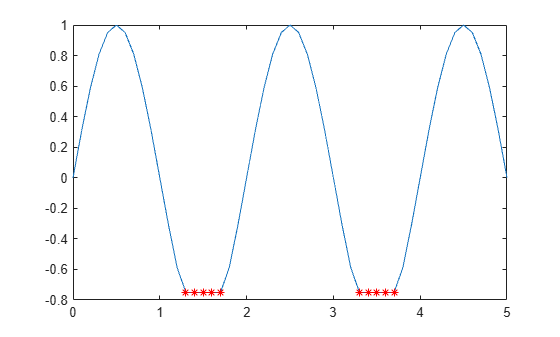
Indicate the minimum of each flat region with all occurrences of that value.
TF2 = islocalmin(A,'FlatSelection','all'); plot(x,A,x(TF2),A(TF2),'r*')
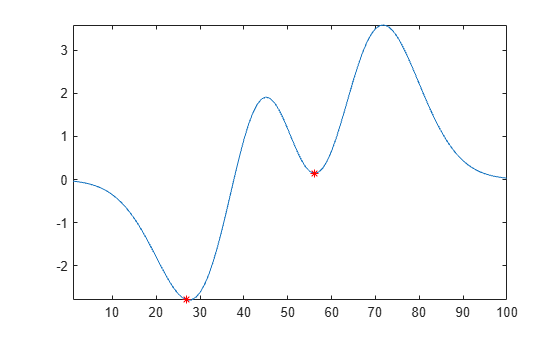
Compute the local minima of a vector of data and their prominence, and then plot them with the data.
x = 1:100; A = peaks(100); A = A(50,:); [TF1,P] = islocalmin(A); P(TF1)
plot(x,A,x(TF1),A(TF1),'r*') axis tight
Compute the most prominent minimum in the data by specifying a minimum prominence requirement.
TF2 = islocalmin(A,'MinProminence',2); plot(x,A,x(TF2),A(TF2),'r*') axis tight
Input Arguments
Input data, specified as a vector, matrix, multidimensional array, table, or timetable.
Operating dimension, specified as a positive integer scalar. If no value is specified, then the default is the first array dimension whose size does not equal 1.
Consider an m-by-n input matrix,A:
islocalmin(A,1)computes local minima according to the data in each column ofAand returns anm-by-nmatrix.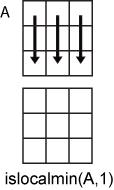
islocalmin(A,2)computes local minima according to the data in each row ofAand returns anm-by-nmatrix.
For table or timetable input data, dim is not supported and operation is along each table or timetable variable separately.
Name-Value Arguments
Specify optional pairs of arguments asName1=Value1,...,NameN=ValueN, where Name is the argument name and Value is the corresponding value. Name-value arguments must appear after other arguments, but the order of the pairs does not matter.
Before R2021a, use commas to separate each name and value, and enclose Name in quotes.
Example: TF = islocalmin(A,'MinProminence',2)
Data Options
Sample points, specified as a vector of sample point values or one of the options in the following table when the input data is a table. The sample points represent the _x_-axis locations of the data, and must be sorted and contain unique elements. Sample points do not need to be uniformly sampled. The vector [1 2 3 ...] is the default.
When the input data is a table, you can specify the sample points as a table variable using one of these options.
| Indexing Scheme | Examples |
|---|---|
| Variable name: A string scalar or character vector | "A" or 'A' — A variable namedA |
| Variable index: An index number that refers to the location of a variable in the tableA logical vector. Typically, this vector is the same length as the number of variables, but you can omit trailing 0 orfalse values | 3 — The third variable from the table[false false true] — The third variable |
| Function handle: A function handle that takes a table variable as input and returns a logical scalar | @isnumeric — One variable containing numeric values |
| Variable type: A vartype subscript that selects one variable of a specified type | vartype("numeric") — One variable containing numeric values |
Note
This name-value argument is not supported when the input data is atimetable. Timetables use the vector of row times as the sample points. To use different sample points, you must edit the timetable so that the row times contain the desired sample points.
Example: islocalmin(A,'SamplePoints',0:0.1:10)
Example: islocalmin(T,'SamplePoints',"Var1")
Table variables to operate on, specified as the comma-separated pair consisting of DataVariables and one of the options in this table. The DataVariables value indicates which variables of the input table to examine for local minima. The data type associated with the indicated variables must be numeric orlogical.
The first output TF containsfalse for variables not specified byDataVariables unless the value ofOutputFormat is'tabular'.
| Indexing Scheme | Values to Specify | Examples |
|---|---|---|
| Variable name | A string scalar or character vectorA string array or cell array of character vectorsA pattern object | "A" or 'A' — A variable named A["A" "B"] or {'A','B'} — Two variables named A andB"Var"+digitsPattern(1) — Variables named"Var" followed by a single digit |
| Variable index | An index number that refers to the location of a variable in the tableA vector of numbersA logical vector. Typically, this vector is the same length as the number of variables, but you can omit trailing0 (false) values. | 3 — The third variable from the table[2 3] — The second and third variables from the table[false false true] — The third variable |
| Function handle | A function handle that takes a table variable as input and returns a logical scalar | @isnumeric — All the variables containing numeric values |
| Variable type | A vartype subscript that selects variables of a specified type | vartype("numeric") — All the variables containing numeric values |
Example: islocalmin(T,'DataVariables',["Var1" "Var2" "Var4"])
Output data type, specified as one of these values:
'logical'— For table or timetable input data, return the outputTFas a logical array.'tabular'— For table input data, return the outputTFas a table. For timetable input data, return the outputTFas a timetable.
For vector, matrix, or multidimensional array input data,OutputFormat is not supported.
Example: islocalmin(T,'OutputFormat','tabular')
Extrema Detection Options
Minimum prominence, specified as a nonnegative scalar.islocalmin returns only local minima whose prominence is at least the value specified.
Prominence window, specified as a positive integer scalar, a two-element vector of positive integers, a positive duration scalar, or a two-element vector of positive durations. The value defines a window of neighboring points for which to compute the prominence for each local minimum.
When the window value is a positive integer scalar_k_, then the window is centered about each local minimum and contains _k_-1 neighboring elements. If k is even, then the window is centered about the current and previous elements. If a local minimum is within a flat region, then islocalmin treats the entire flat region as the center point of the window.
When the value is a two-element vector of positive integers[b f], then the window contains the local minimum, b elements backward, andf elements forward. If a local minimum is within a flat region, then the window starts b elements before the first point of the region and ends f elements after the last point of the region.
When the input data is a timetable or SamplePoints is specified as a datetime orduration vector, the window value must be of typeduration, and the window is computed relative to the sample points.
Flat region indicator for when a local minimum value is repeated consecutively, specified as one of these values:
'center'— Indicate only the center element of a flat region as the local minimum. The element ofTFcorresponding to the center of the flat is 1, and is 0 for the remaining flat elements.'first'— Indicate only the first element of a flat region as the local minimum. The element ofTFcorresponding to the start of the flat is 1, and is 0 for the remaining flat elements.'last'— Indicate only the last element of a flat region as the local minimum. The element ofTFcorresponding to the end of the flat is 1, and is 0 for the remaining flat elements.'all'— Indicate all the elements of a flat region as the local minima. The elements ofTFcorresponding to all parts of the flat are 1.
When using the MinSeparation orMaxNumExtrema name-value arguments, flat region points are jointly considered a single minimum point.
Minimum separation between local minima, specified as a nonnegative scalar. The separation value is defined in the same units as the sample points vector, which is [1 2 3 ...] by default. When the separation value is greater than 0, islocalmin selects the smallest local minimum and ignores all other local minima within the specified separation. This process is repeated until there are no more local minima detected.
When the sample points vector has type datetime, the separation value must have type duration.
Maximum number of minima to detect, specified as a positive integer scalar. islocalmin finds no more than the specified number of the most prominent minima, which is the length of the operating dimension by default.
Output Arguments
Local minima indicator, returned as a vector, matrix, multidimensional array, table, or timetable.
TF is the same size as A unless the value of OutputFormat is 'tabular'. If the value of OutputFormat is'tabular', then TF only has variables corresponding to the DataVariables specified.
Data Types: logical
Prominence, returned as a vector, matrix, multidimensional array, table, or timetable.
- If
Pis a vector, matrix, or multidimensional array,Pis the same size asA. - If
Pis a table or timetable,Pis the same height asAand only has variables corresponding to theDataVariablesspecified.
If the input data has a signed or unsigned integer type, thenP is an unsigned integer.
Algorithms
islocalmin identifies all local minima (or valleys) in the input data and follows these steps to compute the prominence of each local minimum. The prominence of a local minimum measures how the valley stands out with respect to its height and location relative to other valleys.
- Draw a horizontal line to the left and right from the current valley. Stop drawing each segment of the horizontal line when it reaches the edge of the data or intersects the data.
- Identify the peaks above the horizontal line.
- Use the lowest of those peaks as the basis value. The prominence is the absolute difference between the height of the current local minimum and the basis value.

Alternative Functionality
Live Editor Task
You can use islocalmin functionality interactively by adding the Find Local Extrema task to a live script.
Extended Capabilities
Theislocalmin function supports tall arrays with the following usage notes and limitations:
- Tall timetables are not supported.
- You must specify a value for the
ProminenceWindowname-value argument. - The
MaxNumExtrema,MinSeparation, andSamplePointsname-value arguments are not supported. - The value of
DataVariablescannot be a function handle.
For more information, see Tall Arrays.
Usage notes and limitations:
- You must enable support for variable-size arrays.
- The
ProminenceWindowname-value argument is not supported.
The islocalmin function fully supports GPU arrays. To run the function on a GPU, specify the input data as a gpuArray (Parallel Computing Toolbox). For more information, see Run MATLAB Functions on a GPU (Parallel Computing Toolbox).
Version History
Introduced in R2017b
For table or timetable input data, return a tabular output TF instead of a logical array by setting the OutputFormat name-value argument to'tabular'.
For table input data, specify the sample points as a table variable using theSamplePoints name-value argument.