geolimits - Set or query geographic limits - MATLAB (original) (raw)
Set or query geographic limits
Syntax
Description
Specify Limits
geolimits([latlim](#d126e633478),[lonlim](#d126e633517)) adjusts the limits of the current geographic axes, geographic bubble chart, or map axes to include the latitude and longitude limits specified bylatlim and lonlim, respectively. If the current axes is not a geographic axes, a geographic bubble chart, or a map axes, or if there is no current axes, then the function creates a new geographic axes with the specified limits.
Note
The geolimits function typically uses wider limits than the limits you specify to maintain the aspect ratio of the map.
geolimits([limitmode](#mw%5Fb02bacbf-1296-4a20-82ef-c2b5325d8cc8)) specifies automatic or manual limit selection. You can specifylimitmode as one of these values:
"auto"— Enable automatic limit selection. MATLAB® selects the limits based on the range of your data. If you plot into the axes or chart multiple times, the limits update to encompass all the data."manual"— Preserve the current limits as closely as possible.
You can specify the limitmode argument without parentheses. For example, geolimits auto enables automatic limit selection.
Query Limits
[[latlimOut](#d126e633644),[lonlimOut](#d126e633666)] = geolimits returns the current latitude and longitude limits.
[[latlimOut](#d126e633644),[lonlimOut](#d126e633666)] = geolimits(___) adjusts the limits and then returns the actual limits, using any combination of inputs from the previous syntaxes.
Specify Target Axes or Chart
[___] = geolimits([ax](#mw%5Fafc65b26-93bf-4564-aead-b5a25c05da66),___) uses the axes or chart specified by ax.
Examples
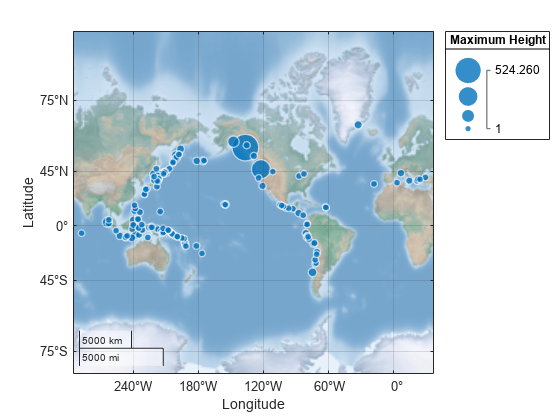
Read a spreadsheet containing tsunami (tidal wave) events into the workspace as a table. The Latitude and Longitude table variables contain the locations of the tsunami events. The MaxHeight table variable contains the maximum heights of the tsunamis.
T = readtable("tsunamis.xlsx");
lat = T.Latitude; lon = T.Longitude; sz = T.MaxHeight;
Display the data using a geographic bubble chart over a terrain basemap. Specify the bubble sizes using the tsunami heights. Change the title of the size legend using the SizeLegendTitle name-value argument.
geobubble(lat,lon,sz,SizeLegendTitle="Maximum Height") geobasemap colorterrain
Zoom into a region containing British Columbia and the western United States by changing the latitude and longitude limits.
geolimits([28 65],[-158 -100])
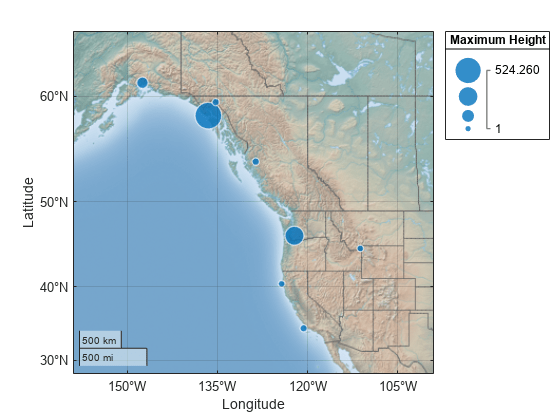
To maintain the aspect ratio of the latitude and longitude axes, the geolimits function typically uses limits that cover a larger region than the limits you specify. Query the actual limits of the map.
[latitudeLimits,longitudeLimits] = geolimits
latitudeLimits = 1×2
28 65longitudeLimits = 1×2
-166.3082 -91.6918
Load a MAT file containing coordinates for the perimeter of the contiguous United States into the workspace. The variables within the MAT file, uslat and uslon, specify numeric latitude and longitude coordinates, respectively. Display the coordinates over a topographic basemap.
load usapolygon.mat geoplot(uslat,uslon) geobasemap topographic

Query the latitude and longitude limits.
[latitudeLimits,longitudeLimits] = geolimits
latitudeLimits = 1×2
21.8982 51.7816
longitudeLimits = 1×2
-126.1638 -65.5263
Use manual mode to maintain the current latitude and longitude limits when you add more plots to an axes.
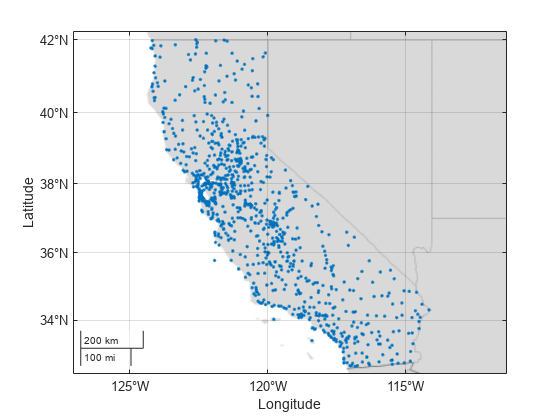
Read a spreadsheet containing cell tower data into the workspace as a table. The Latitude and Longitude table variables represent the locations of the cell towers. Display the tower locations using point markers over the grayland basemap.
load cellularTowers.mat lat1 = cellularTowers.Latitude; lon1 = cellularTowers.Longitude;
geoscatter(lat1,lon1,".") geobasemap grayland
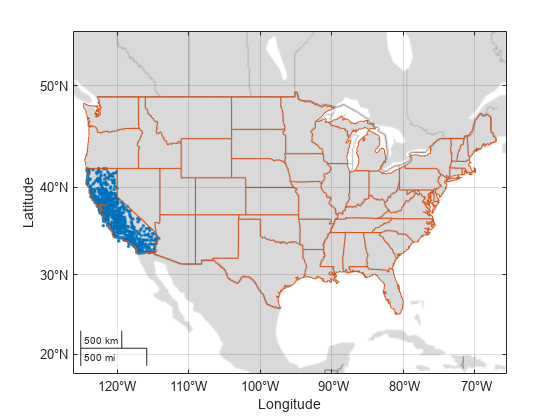
Load a MAT file containing coordinates for each contiguous US state into the workspace. The MAT file contains a structure array with latitude and longitude fields. Extract the latitudes and longitudes from the structure array.
load usastates.mat lat2 = [usastates.Lat]; lon2 = [usastates.Lon];
Set the geographic limits mode to manual so that the limits do not change. Use hold on to add a second plot to the axes.
geolimits manual hold on geoplot(lat2,lon2)

The limits do not update to incorporate the new plot.
Switch back to automatically updated limits by resetting the mode to automatic.
Input Arguments
Latitude limits, specified as a two-element vector with elements in the range [–90, 90]. Specify the latitude limits using the form [latmin latmax], where latmax is greater thanlatmin.
In most cases, the latitude limits of geographic axes and charts do not extend outside of the range [–85, 85] degrees. For more information about exploring geographic axes and charts, see Interact with Geographic Axes.
Example: [50 65]
Data Types: single | double
Minimum and maximum longitude limits, specified as a two-element vector of the form [lonmin lonmax], where lonmax is greater than lonmin.
Example: [-175 -130]
Data Types: single | double
Limit mode, specified as one of these values:
"auto"— Enable automatic limit selection, which is based on the span of the data. If you plot into the axes multiple times, the limits update to encompass all the data. You can use this option if you change the limits and want to set them back to the default values."manual"— Preserve the current limits as closely as possible. Use this option if you want to retain the current limits when adding new data to the axes using thehold oncommand.
Data Types: char | string
Target axes or chart, specified as a GeographicAxes object1 , GeographicBubbleChart object, orMapAxes (Mapping Toolbox™) object.
If you do not specify this argument, then thegeolimits function adjusts the limits of the current axes, provided that the current axes is a geographic axes object, a geographic bubble chart, or a map axes object.
Output Arguments
Actual latitude limits, returned as two-element vector of the form[latmin latmax].
Actual longitude limits, returned as two-element vector of the form[lonmin lonmax].
Version History
Introduced in R2017b
1 Alignment of boundaries and region labels are a presentation of the feature provided by the data vendors and do not imply endorsement by MathWorks®.