ginput - Identify axes coordinates - MATLAB (original) (raw)
Identify axes coordinates
Syntax
Description
[[x](#mw%5F1d21f9df-b2c8-4047-a42d-521bd1d69668),[y](#mw%5F562d33c9-f848-4883-9e45-40122890d2ec)] = ginput([n](#mw%5Facacdcdf-0d06-4bf9-9cab-7eb90d102b29)) allows you to identify the coordinates of n points within Cartesian, polar, or geographic axes. To choose a point, move your cursor to the desired location and press either a mouse button or a key on the keyboard. Press the Return key to stop before all n points are selected. MATLAB® returns the coordinates of your selected points. If there are no axes, callingginput creates a Cartesian axes object.
[[x](#mw%5F1d21f9df-b2c8-4047-a42d-521bd1d69668),[y](#mw%5F562d33c9-f848-4883-9e45-40122890d2ec)] = ginput allows you to select an unlimited number of points until you press the Return key.
[[x](#mw%5F1d21f9df-b2c8-4047-a42d-521bd1d69668),[y](#mw%5F562d33c9-f848-4883-9e45-40122890d2ec),[button](#mw%5F55de87bc-c230-4690-acf8-b3821a5d710d)] = ginput(___) also returns the mouse button or key on the keyboard used to select each point.
Examples
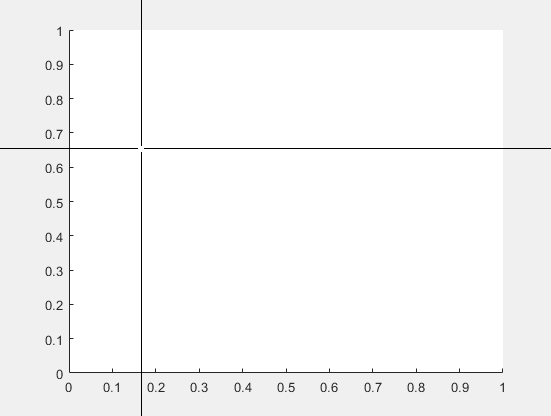
Identify four points in a set of axes using ginput. To select each point, move the cursor to your desired location and press a mouse button or key.
x =
0.3699
0.4425
0.5450
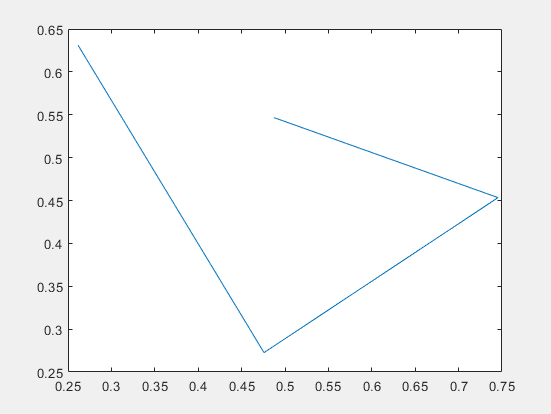
0.6130y =
0.6690
0.5605
0.4719
0.6025
Plot the identified points.
Identify five coordinates in a set of axes using ginput. To select each point, move the cursor to your desired location and press a mouse button, lowercase letter, uppercase letter, number, or the space bar. Return the mouse buttons or Unicode® numbers of the keys used to select each point.
[x,y,button] = ginput(5); button
In this case, the coordinates were identified using the right mouse button (3), the lowercase letter h (104), the space bar (32), the number3 (51), and the uppercase letter R (82).
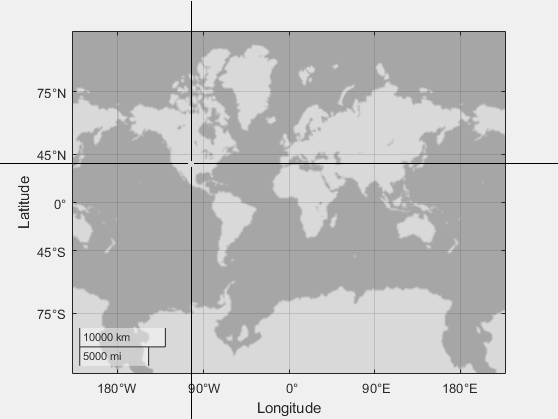
Create geographic axes and identify the latitude and longitude coordinates of four points. Then, plot the points that you identify.
geoaxes [lat,lon] = ginput(4);
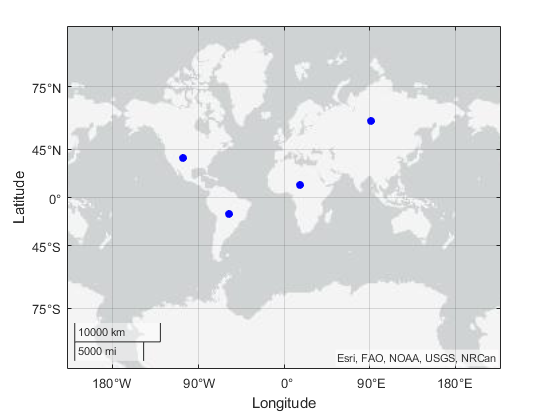
Use the hold on command and the geolimits function to maintain the map limits. Plot the identified points.
hold on geolimits('manual') geoscatter(lat,lon,'filled','b')
Input Arguments
Number of points to identify, specified as a positive integer.
Output Arguments
First components of the identified coordinates, returned as a scalar or column vector.
- For Cartesian axes, the values are
x-coordinates. - For polar axes, the values are theta angles. The theta angles are in the range
[tmin, tmin+2*pi], wheretminis the first value of the ThetaLim vector of the polar axes. The angles are measured from the location of the zero angle in the direction specified by the ThetaDir property. The location of the zero angle is specified by the ThetaZeroLocation property. - For geographic axes, the values are latitudes. Positive values correspond to north and negative values correspond to south.
If you choose points outside the axes limits, the values are relative to the origin for Cartesian and geographic axes. For polar axes, the values are relative to the ThetaZeroLocation.
Second components of the identified coordinates, returned as a scalar or column vector.
- For Cartesian axes , the values are
y-coordinates. - For polar axes, the values are radii. Each radius value is greater than or equal to
rmin, whererminis the first value in the RLim vector of the polar axes. - For geographic axes, the values are longitudes. Positive values correspond to locations east of the origin and negative values correspond to locations west of the origin.
If you choose points outside the axes limits, values are still returned relative to the axes origin.
Keys or mouse buttons used to identify points, returned as a scalar or column vector. Mouse buttons are indicated by 1 for the left button, 2 for the middle, and 3 for the right. Double-clicks are indicated by two values. The first value is 1 for the left mouse button, 2 for the middle, and 3 for the right. The second value is 1.
Keys on the keyboard are indicated by their corresponding Unicode numbers. Taps on a screen are indicated by 1.
For example, call ginput, click using the middle mouse button, double-click using the right mouse button, and then press Enter. The output button is a vector containing 2,3, and 1.
Version History
Introduced before R2006a
The button output argument indicates an expanded set of keys by returning the Unicode numbers for the pressed key. Previously, the argument returned the ASCII number. This change provides key data for a larger set of keyboard keys across different writing systems.