gtext - Add text to figure using mouse - MATLAB (original) (raw)
Add text to figure using mouse
Syntax
Description
gtext([str](#f23-712080-str)) inserts the text, str, at the location you select with the mouse. When you hover over the figure window, the pointer becomes a crosshair. gtext is waiting for you to select a location. Move the pointer to the location you want and either click the figure or press any key, except Enter.
gtext([str](#f23-712080-str),[Name,Value](#namevaluepairarguments)) specifies text properties using one or more name-value pair arguments. For example, 'FontSize',14 specifies a 14-point font.
`t` = gtext(___) returns an array of text objects created by gtext. Use t to modify properties of the text objects after they are created. For a list of properties and descriptions, see Text Properties. You can return an output argument using any of the arguments from the previous syntaxes.
Examples
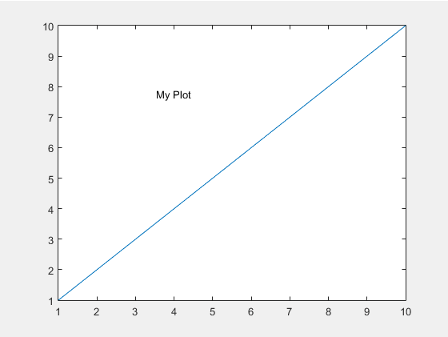
Create a simple line plot and use gtext to add text to the figure using the mouse.
plot(1:10) gtext('My Plot')

Click the figure to place the text at the selected location.
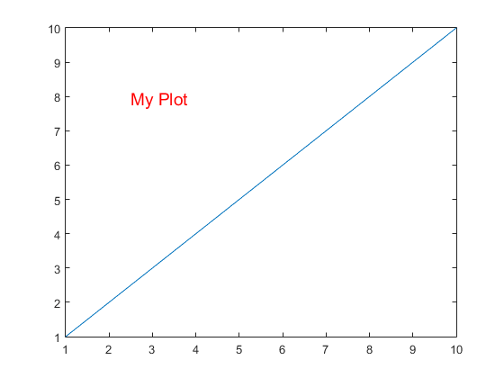
Create a simple line plot and add text to the figure using the mouse. Use a red, 14-point font.
plot(1:10) gtext('My Plot','Color','red','FontSize',14)
Click the figure where you want to display the text.
Create a simple line plot and add text to the figure using the mouse. Return the text object created, t.
plot(1:10) t = gtext('My Plot')
Click the figure to place the text and create the text object.

t =
Text (My Plot) with properties:
             String: 'My Plot'
           FontSize: 10
         FontWeight: 'normal'
           FontName: 'Helvetica'
              Color: [0 0 0]
HorizontalAlignment: 'left'
           Position: [4.3906 5.3950 0]
              Units: 'data'
Show all properties
Use t to change the font size and color of the text by setting text properties. Use dot notation to set properties.
t.Color = 'red'; t.FontSize = 14;
Input Arguments
Text to display, specified in one of these forms:
- Character vector — Display the text with one click, for example:
- Cell array of character vectors — Display one row of the array with each click. For example, this code displays
firstwith the first click andsecondwith the second click.
gtext({'first';'second'})
To display multiline text, specify more than one character vector per row.
gtext({'first','new line';'second','new line'}) - Character array — Display one row of the array with each click. Each row must contain the same number of characters, for example:
- String array — Display one row of the array with each click. For example:
To include special characters, such as superscripts, subscripts, Greek letters, or mathematical symbols, use TeX markup. For a list of supported markup, see the Interpreter property.
Name-Value Arguments
Specify optional pairs of arguments asName1=Value1,...,NameN=ValueN, where Name is the argument name and Value is the corresponding value. Name-value arguments must appear after other arguments, but the order of the pairs does not matter.
Before R2021a, use commas to separate each name and value, and enclose Name in quotes.
Example: text(.5,.5,'my text','FontSize',14,'Color','red')
The properties listed here are only a subset. For a full list, see Text Properties.
Note
You cannot specify the Position text property as a name-value pair during text creation. gtext ignores the specified value.
Data Types: single | double | int8 | int16 | int32 | int64 | uint8 | uint16 | uint32 | uint64
Algorithms
gtext uses the ginput and text functions.
Version History
Introduced before R2006a