hold - Retain current plot when adding new plots - MATLAB (original) (raw)
Retain current plot when adding new plots
Syntax
Description
hold on sets the axes hold state to on, which retains plots in the current axes so that new plots added to the axes do not delete existing plots. When the hold state is on, new plots use the next colors and line styles based on theColorOrder and LineStyleOrder properties of the axes. MATLAB® adjusts axes limits, tick marks, and tick labels to display the full range of data. If an axes object does not exist, then the hold command creates one.
hold off sets the axes hold state to off so that new plots added to the axes clear existing plots and reset all axes properties. When the hold state is off, the next plot added to the axes uses the first color and line style based on theColorOrder and LineStyleOrder properties of the axes. This option is the default behavior.
hold toggles the hold state between on and off.
hold([state](#mw%5Fc06c63b9-522e-44de-bbdb-acf73fb53fc6)) sets the axes hold state by specifying a state value. You can specify state as"on", "off", a logical value, or anOnOffSwitchState value.
hold([ax](#buep2ce-1-ax),___) sets the hold state for the axes specified by ax instead of the current axes. Specifyax before all other arguments.
Examples
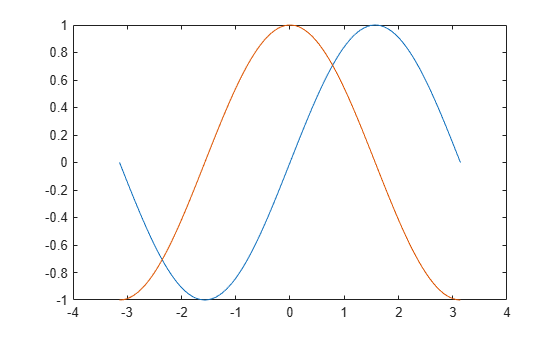
Create a line plot. Use hold on to add a second line plot without deleting the existing line plot. The new plot uses the next color and line style based on the ColorOrder and LineStyleOrder properties of the axes. Then reset the hold state to off.
x = linspace(-pi,pi); y1 = sin(x); plot(x,y1)
hold on y2 = cos(x); plot(x,y2) hold off
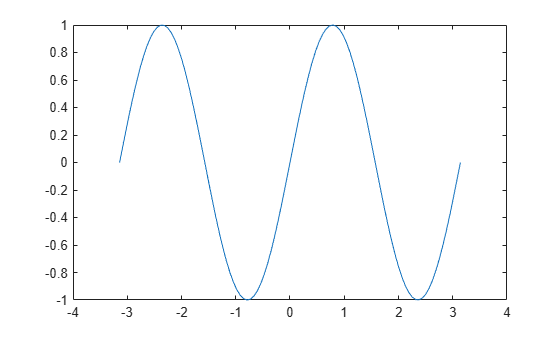
When the hold state is off, new plots delete existing plots. New plots start from the beginning of the color order and line style order.
y3 = sin(2*x); plot(x,y3)
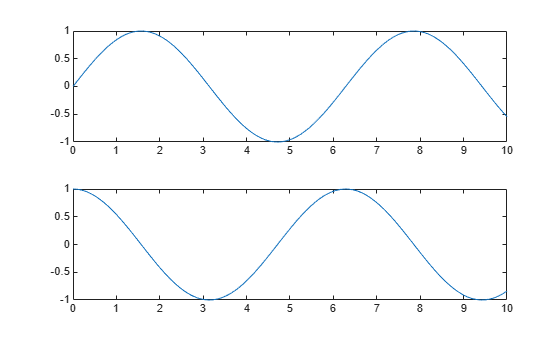
You can display a tiling of plots using the tiledlayout and nexttile functions. Call the tiledlayout function to create a 2-by-1 tiled chart layout. Call the nexttile function to create the axes objects ax1 and ax2. Plot a sine wave plot in each axes.
x = linspace(0,10); y1 = sin(x); y2 = cos(x); tiledlayout(2,1)
% Top plot ax1 = nexttile; plot(ax1,x,y1)
% Bottom plot ax2 = nexttile; plot(ax2,x,y2)
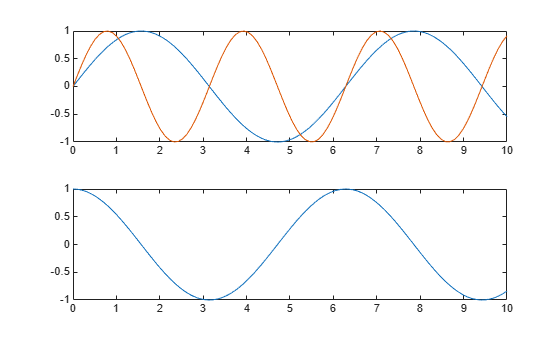
Add a second sine wave to the top axes.
hold(ax1,'on') y3 = sin(2*x); plot(ax1,x,y3) hold(ax1,'off')
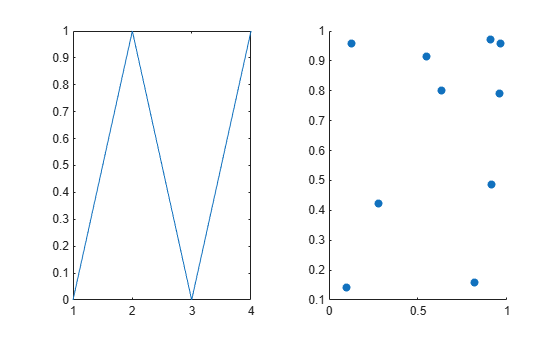
Create a 1-by-2 tiled chart layout. Call the nexttile function to create two axes objects and plot into the axes.
t = tiledlayout(1,2); ax1 = nexttile; ax2 = nexttile; plot(ax1,[0 1 0 1]) scatter(ax2,rand(1,10),rand(1,10),'filled')
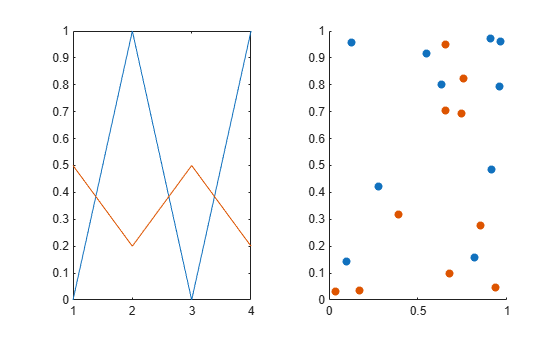
Set the hold state for both of the axes to 'on'. Then display additional data in each plot.
hold([ax1 ax2],'on') plot(ax1,[.5 .2 .5 .2]) scatter(ax2,rand(1,10),rand(1,10),'filled')
Input Arguments
Axes hold state, specified one of these values:
"on"or"off"— A value of"on"sets the hold state to on, and"off"sets the state to off. You can also specify the character vectors'on'or'off'.- Numeric or logical
1(true) or0(false) — A value of1ortruesets the hold state to on, and0orfalsesets the state to off. (since R2024a) - A matlab.lang.OnOffSwitchState value — A value of
matlab.lang.OnOffSwitchState.onsets the hold state to on, andmatlab.lang.OnOffSwitchState.offsets the state to off. (since R2024a)
Target axes, specified as one of the following:
- Any type of axes object: an
Axes,PolarAxes, orGeographicAxesobject. - An array of axes objects that belong to the same class. To determine the class, use the class function.
If you do not specify the axes, then hold sets the hold state for the current axes.
Tips
- Use the
isholdfunction to test the hold state.
Algorithms
The hold function sets these properties:
- NextPlot axes property - Sets this property of the associated
Axes,PolarAxes, orGeographicAxesobject to either'add'or'replace'. - NextPlot figure property - Sets this property of the
Figureobject to'add'.
Version History
Introduced before R2006a
The "all" option is not recommended. Specify the"on" option instead, which has the same effect. The"on" option has been recommended over the "all" option since R2014b. However, there are no plans to remove the "all" option.
| Not Recommended | Recommended |
|---|---|
| hold all | hold on |
| hold("all") | hold("on") |
| hold(ax,"all") | hold(ax,"on") |
Change the axes hold state by specifying logical value or a matlab.lang.OnOffSwitchState value. The values 1 andtrue are equivalent to "on", and0 and false are equivalent to"off".
The values "on" and "off" are still supported.