orderedcolors - Color palettes for visualizing multiple data series - MATLAB (original) (raw)
Main Content
Color palettes for visualizing multiple data series
Since R2023b
Syntax
Description
C = orderedcolors([palettename](#mw%5F57c1db9d-b955-4cac-89c0-85d9739cdd94)) returns the colors of a predefined color palette. For example, C = orderedcolors("gem") returns the colors of the gem color palette. Each row of the three column matrix C contains the red, green, and blue intensities for a specific color. The intensities are in the range [0, 1].
Examples
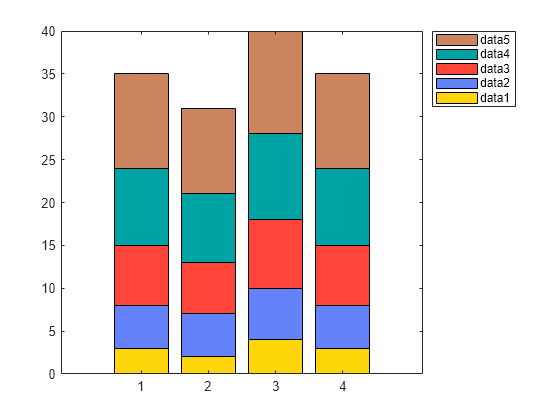
Create a stacked bar chart containing four bars with five sections each.
y = [3 5 7 9 11; 2 5 6 8 10; 4 6 8 10 12; 3 5 7 9 11];
bar(y,"stacked") legend(Location="northeastoutside")

Change the colors of the chart to the last five colors of the 12-color gem12 palette. Get the RGB triplets of the gem12 palette and store them in matrix C. Change the colors of the chart by calling the colororder function and specifying the last five rows of the matrix.
C = orderedcolors("gem12"); colororder(C(8:12,:))
You can get the RGB triplets of a palette and use them to customize other aspects of your visualization. In this case, match the color of the figure to one of the palette colors.
Create a scatter plot with the reef color palette.
f = figure; scatter(rand(10,10),rand(10,10),"filled") colororder("reef")
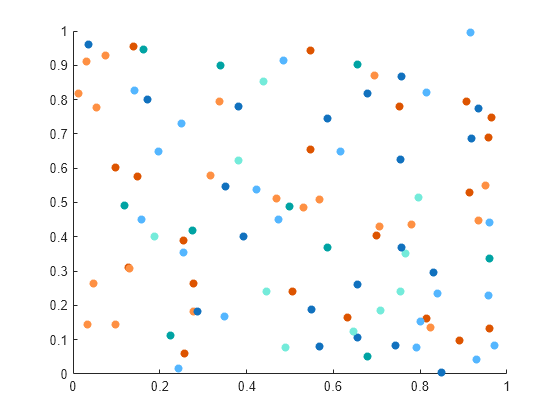
Get the RGB triplets of the color palette.
C = orderedcolors("reef")
C = 6×3
0.8660    0.3290         0
0.3290    0.7130    1.0000
0.0660    0.4430    0.7450
0.9960    0.5640    0.2620
0.4540    0.9210    0.8540
     0    0.6390    0.6390
Change the color of the figure to the fifth color in the reef palette.

Input Arguments
Color palette name, specified as one of the values in this table. The"gem" color palette is the default color scheme for most plots.
| Palette Name | Palette Colors |
|---|---|
| "gem" (Light theme default) |  |
| "gem12" |  |
| "glow" (Dark theme default) |  |
| "glow12" |  |
| "sail" |  |
| "reef" |  |
| "meadow" |  |
| "dye" |  |
| "earth" |  |
Version History
Introduced in R2023b
The "gem" palette colors have changed slightly. This table lists the changes.
| R2024b Colors | R2025a Colors |
|---|---|
RGB TripletSample[0.0000 0.4470 0.7410]  [0.8500 0.3250 0.0980] [0.8500 0.3250 0.0980]  [0.9290 0.6940 0.1250] [0.9290 0.6940 0.1250]  [0.4940 0.1840 0.5560] [0.4940 0.1840 0.5560]  [0.4660 0.6740 0.1880] [0.4660 0.6740 0.1880]  [0.3010 0.7450 0.9330] [0.3010 0.7450 0.9330]  [0.6350 0.0780 0.1840] [0.6350 0.0780 0.1840]  |
RGB TripletSample[0.0660 0.4430 0.7450]  [0.8660 0.3290 0.0000] [0.8660 0.3290 0.0000]  [0.9290 0.6940 0.1250] [0.9290 0.6940 0.1250]  [0.5210 0.0860 0.8190] [0.5210 0.0860 0.8190]  [0.2310 0.6660 0.1960] [0.2310 0.6660 0.1960]  [0.1840 0.7450 0.9370] [0.1840 0.7450 0.9370]  [0.8190 0.0150 0.5450] [0.8190 0.0150 0.5450]  |