parula - Parula colormap array - MATLAB (original) (raw)
Main Content

Syntax
Description
c = parula returns the parula colormap as a three-column array with the same number of rows as the colormap for the current figure (gcf). If no figure exists, then the number of rows is equal to the default length of 256. Each row in the array contains the red, green, and blue intensities for a specific color. The intensities are in the range [0,1], and the color scheme looks like this image.

c = parula([m](#bvic1z5-1%5Fsep%5Fshared-m)) returns the colormap with m colors.
Examples
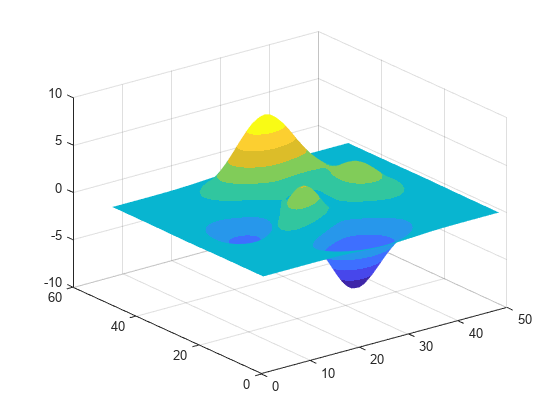
Plot a surface with the default parula colormap.

Get the parula colormap array and reverse the order. Then apply the modified colormap to the surface.
c = parula; c = flipud(c); colormap(c);

Get a downsampled version of the parula colormap containing only ten colors. Then display the contours of the peaks function by applying the colormap and interpolated shading.
c = parula(10); surf(peaks); colormap(c); shading interp;
Input Arguments
Number of colors, specified as a nonnegative integer. The default value ofm is the number of colors in the current figure's colormap. If no figure exists, the default value is 256.
Data Types: single | double | int8 | int16 | int32 | int64 | uint8 | uint16 | uint32 | uint64
Version History
Introduced in R2014b
Starting in R2019b, colormaps have 256 colors by default.
In R2019a and previous releases, the default size is 64. If you have code that depends on a colormap having 64 colors, specify the number of colors when you set the colormap for the figure, axes, or chart. For example,colormap(parula(64)) sets the figure's colormap to the 64-color parula colormap.
Alternatively, you can change the default colormap for all figures within your MATLAB® session:
set(groot,'defaultFigureColormap',parula(64))
Starting in R2017a, the colors in the parula colormap are slightly different than in previous releases. This table shows a comparison between the R2017a and earlier versions of the colormap. The visual change is subtle; however, you might notice more colorful colors and smoother transitions between colors.
| | | |
| ------------------ | ----------------------------------------------------------------------------------------------------------------------------- |
| R2017a and later | |
| R2016b and earlier |  |
|