rlim - Set or query r-axis limits for polar
axes - MATLAB (original) (raw)
Set or query _r_-axis limits for polar axes
Syntax
Description
Specify Limits
rlim([limits](#bu5hn1o-limits)) specifies the_r_-axis limits for the current polar axes. Specifylimits as a two-element vector of the form [rmin rmax], where rmax is a numeric value greater than rmin.
rlim([limitmode](#mw%5Fb2c42ffb-a1a0-40f0-98ad-3171b6c99473)) specifies automatic or manual limit selection. The limitmode can have either of two values:
"auto"— Enable automatic limit selection. MATLAB® chooses the _r_-axis limits."manual"— Freeze the _r_-axis limits at their current value. Use this option if you want to retain the current limits when adding new data to the polar axes using thehold oncommand.
Query Limits
[rl](#bu5hn1o-rl) = rlim returns a two-element vector containing the limits for the current polar axes.
[m](#bu5hn1o-m) = rlim("mode") returns the current value of the limits mode, which is either 'auto' or'manual'. By default, the mode is automatic unless you specify limits or set the mode to manual.
Specify Target Axes
___ = rlim([pax](#bu5hn1o-pax),___) uses the polar axes specified by pax instead of the current polar axes. Specify pax as the first input argument. Include additional input or output arguments only if the original syntax supported them.
Examples
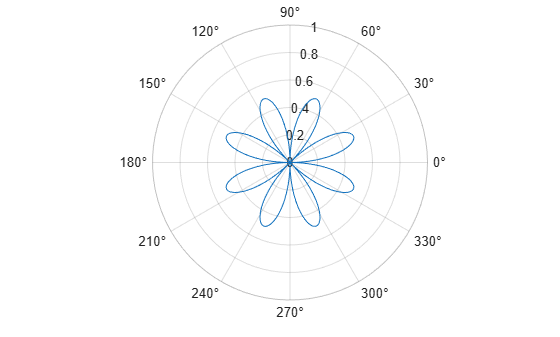
Create a polar plot and change the _r_-axis limits.
theta = 0:0.01:2pi; rho = sin(2theta).cos(2theta); polarplot(theta,rho) rlim([0 1])
Set the limits back to the original values.
Create a polar plot using negative radius values. By default, polarplot reflects negative values through the origin.
theta = linspace(0,2*pi); rho = sin(theta); polarplot(theta,rho)

Change the limits of the _r_-axis so it ranges from -1 to 1.

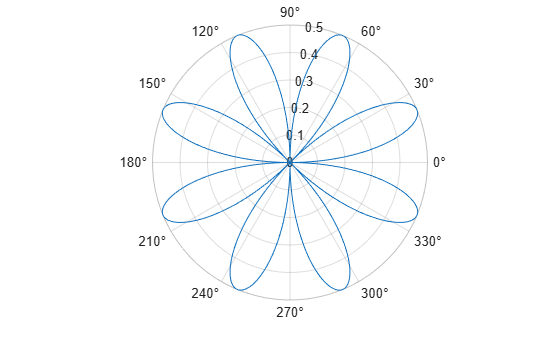
Create a polar plot and return the _r_-axis limits.
theta = 0:0.01:2pi; rho = sin(2theta).cos(2theta); polarplot(theta,rho)

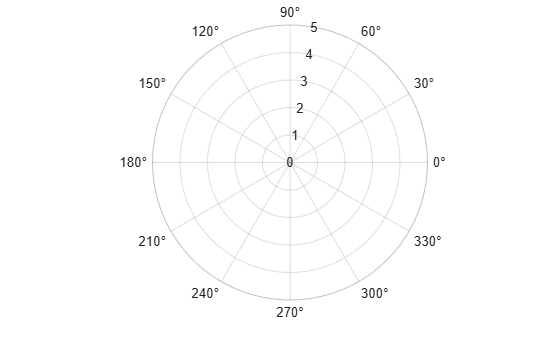
Set the limits for a specific polar axes by specifying the polar axes object as the first input to rlim. Otherwise, rlim sets the limits for the current axes.
pax = polaraxes; rlim(pax,[0 5])
Input Arguments
Minimum and maximum limits, specified as a two-element vector of the form [rmin rmax], where rmax is a numeric value greater than rmin. You can specify both limits, or specify one limit and let MATLAB automatically calculate the other.
- To automatically set the minimum limit to the minimum data value, specify the first element as
-inf, for example,rlim([-inf 0]). - To automatically set the maximum limit to the maximum data value, specify the second element as
inf, for example,rlim([0 inf]).
When you specify the limits, the RLim property for the polar axes object updates to the specified values and the RLimMode property changes to 'manual'.
Example: rlim([0 1])
Limit mode, specified as one of the following values:
"auto"— Enable automatic limit selection, which is based on the total span of the data. If you plot into the axes multiple times, the limits update to encompass all the data. You can use this option if you change the limits and want to set them back to the default values."manual"— Freeze the limits at the current values. Use this option if you want to retain the current limits when adding new data to the axes using thehold oncommand.
When you specify this argument, MATLAB sets the RLimMode property of the axes to the value you specify. However, the RLimMode property changes to "manual" whenever you set the_r_-axis limits explicitly, either by callingrlim(limits), or by setting the value of theRLim property on the axes.
Polar axes, or an array of polar axes. If you do not specify this argument, then rlim sets the limits for the current axes (provided that the current axes is a polar axes object).
Output Arguments
Current limits, returned as a two-element vector of the form [rmin rmax]. Querying the limits returns the value of the RLim property for the polar axes object.
Current limits mode, returned as one of these values:
'auto'— The limits automatically update to reflect changes in the data.'manual'— The limits do not automatically update to reflect changes in the data.
Querying the _r_-axis limits mode returns the value of the RLimMode property for the polar axes object.
Version History
Introduced in R2016a