rose - (Not recommended) Angle histogram - MATLAB (original) (raw)
(Not recommended) Angle histogram
Syntax
Description
rose([theta](#mw%5Fd9e2105a-3651-4046-aa70-1391ab74bbb0)) creates an angle histogram, which is a polar plot that shows the distribution of angles intheta.
rose([theta](#mw%5Fd9e2105a-3651-4046-aa70-1391ab74bbb0),[x](#mw%5F289a8e3f-afed-47fc-85ee-7cf61cd82378)) uses the number of bins and the bin locations specified by vector x. The values in x specify the center angle of each bin, andlength(x) is the number of bins.
rose([theta](#mw%5Fd9e2105a-3651-4046-aa70-1391ab74bbb0),[nbins](#mw%5F4f9d720a-395f-4071-b946-a0bb1979f92f)) plots the specified number of equally spaced bins in the range[0,2*pi].
rose([ax](#mw%5Fc888797e-b40d-4cd8-ad40-2740cef5e176),___) plots into the specified axes instead of the current axes (gca).
[ln](#mw%5F9dcd55e4-1b96-4a9e-afb4-a0c389e29c34) = rose(___) returns theLine object used to create the angle histogram. Useln to modify the histogram after it is created. For a list of properties, see Line Properties.
[[t](#mw%5Ffdbdf911-e4ca-44e2-8c35-3a5554d946b9),[r](#mw%5F802740fb-2031-40ee-90e8-bc6b7a911630)] = rose(___) returns the angle and radius values of the bins that can be used inpolarplot(t,r) to generate the histogram. This syntax does not generate a plot.
Examples
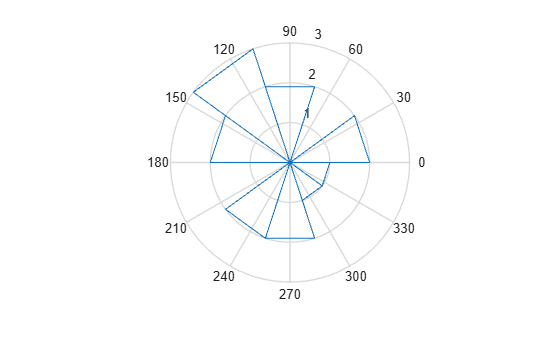
Create an angle histogram of values between 0 and 2π. Distribute the data among 10 bins.
theta = [0.4 1.4 3.1 2.3 0.4 2.5 3.9 2.8 2.3 1.6 4.6 4.5 6.1 3.9 5.1]; rose(theta,10)
Input Arguments
Data to distribute among bins, specified as a vector of angles expressed in radians. If you do not specify nbins, then rose distributes the data among 20 bins or fewer. The length of each bin corresponds to the number of elements in theta that fall within the start and end angles of that bin, from 0 to the greatest number of elements deposited in any one bin.
Bin centers, specified as a vector of angles expressed in radians. For example, ifx is a five-element vector, rose distributes the elements of theta among five bins centered at the specified values in x.
Number of bins, specified as a positive integer. rose plotsnbins equally spaced bins in the range [0,2*pi]. If you do not specify nbins, then rose distributes the data among 20 bins or fewer.
Target axes, specified as an Axes object. If you do not specify the axes, MATLAB® plots into the current axes or it creates an Axes object if one does not exist. rose does not support plotting intoPolarAxes objects.
Output Arguments
Angle histogram, returned as a Line object. Use this output to modify the appearance of the angle histogram. For more information about the properties you can set for these objects, see Line Properties.
Angle values of bins, returned as a vector. Use t withr to generate an angle histogram in a PolarAxes object by passing them as inputs to the polarplot function. Each bin in the histogram is represented by four distinct points. The length of t is 4 times the number of bins.
Radius values of bins, returned as a vector. Use r witht to generate an angle histogram in a PolarAxes object by passing them as inputs to the polarplot function. Each bin in the histogram is represented by four distinct points. The length of r is 4 times the number of bins.
Extended Capabilities
The rose function supports GPU array input with these usage notes and limitations:
- This function accepts GPU arrays, but does not run on a GPU.
For more information, see Run MATLAB Functions on a GPU (Parallel Computing Toolbox).
Version History
Introduced before R2006a
rose is not recommended. Use polarhistogram instead. There are no plans to removerose.
The polarhistogram function uses graphics objects that are designed for polar coordinate and histogram data. These objects have more relevant customization options than the objects used by rose. The benefits of usingpolarhistogram over rose include:
polarhistogramplots into aPolarAxesobject instead of anAxesobject. For example, you can change the location of 0 by setting theThetaZeroLocationproperty of thePolarAxesobject.polarhistogramcreates aHistogramobject instead of aLineobject. For example, you can color the bins by setting theFaceColorproperty of theHistogramobject.
This table shows some typical uses of rose and how to update your code to use polarhistogram instead.
| Objective | Not Recommended | Recommended | Differences |
|---|---|---|---|
| Specify the number of bins. | rose(theta,nbins) | polarhistogram(theta,nbins) | No difference. |
| Specify the locations of bins. | rose(theta,x) | polarhistogram(theta,edges) | For rose, x specifies the center angle of each bin. length(x) is the total number of bins.For polarhistogram, edges specifies the start and end values of each bin.length(edges)-1 is the total number of bins. |
| Specify the target axes. | rose(ax,__) | polarhistogram(pax,__) | rose accepts an Axes target axes.polarhistogram accepts a PolarAxes target axes. |
| Specify a PolarAxes target axes. | [t,r] = rose(theta) polarplot(pax,t,r) | polarhistogram(pax,theta) | rose accepts an Axes target axes only. Use the polarplot function and specifypax, a PolarAxes object along with two output arguments from rose.polarhistogram accepts a PolarAxes target axes. |
| Modify the appearance of the angle histogram. | ln = rose(theta)Then, use dot notation with ln to change the graph appearance. | polarhistogram(theta,Name,Value)orh = polarhistogram(theta)Then, use dot notation with h to change the graph appearance. | For rose, ln is aLine object. Use dot notation to set any properties of the line. For a list of properties, see Line Properties.For polarhistogram, h is aHistogram object. Use dot notation or name-value arguments to set any properties of the histogram. For a list of properties, see Histogram Properties. |