unstack - Unstack data from input table or timetable into multiple variables of output
table or timetable - MATLAB ([original](https://in.mathworks.com/help/matlab/ref/table.unstack.html)) ([raw](?raw))Unstack data from input table or timetable into multiple variables of output table or timetable
Syntax
Description
[U](#btzaco8-1-U) = unstack([S](#btzaco8-1-S),[vars](#btzaco8-1-vars),[ivar](#btzaco8-1-ivar)) unstacks data from specified variables of the input table or timetable into multiple variables of the output table or timetable. The input argumentvars specifies the variables to unstack. In general, the output contains more variables, but fewer rows, than the input.
The input argument ivar specifies the_indicator_ variable. In each row of the input, the value of the indicator variable indicates the corresponding variable of the output. Theunstack function aggregates data with matching indicator values. Then it distributes the aggregated values across the variables of the output.
The default aggregation method depends on the data type. For example, by defaultunstack aggregates numeric data by summing it.
The input might have other variables not specified as vars orivar. The unstack function treats the remaining variables differently in tables and timetables.
- If
Sis a table, thenunstacktreats the remaining variables as grouping variables. Each unique combination of values in the grouping variables identifies a group of rows inSthat is unstacked into one row ofU. - If
Sis a timetable, thenunstackdiscards the remaining variables. However,unstacktreats the vector of row times as a grouping variable.
You cannot unstack the row names of a table, or the row times of a timetable, or specify either as the indicator variable.
[U](#btzaco8-1-U) = unstack([S](#btzaco8-1-S),[vars](#btzaco8-1-vars),[ivar](#btzaco8-1-ivar),[Name=Value](#namevaluepairarguments)) specifies options using one or more name-value arguments in addition to the input arguments in the previous syntax. For example, you can specify your own names for the new and unstacked variables in the output.
[[U](#btzaco8-1-U),[is](#btzaco8-1-is)] = unstack(___) also returns an index vector,is, indicating the correspondence between rows inU and rows in S. You can use any of the input arguments in previous syntaxes.
Examples
Load a table from the snowfall.mat sample file indicating the amount of snowfall in various towns for various storms. The table contains three snowfall entries for each storm, one for each town. It is in stacked format, with Storm and Town having the categorical data type. Table variables that have the categorical data type are useful as indicator variables and grouping variables.
S=12×3 table Storm Town Snowfall _____ _________ ________
  3      Natick           0
  3      Worcester        3
  1      Natick           5
  3      Boston           5
  1      Boston           9
  1      Worcester       10
  4      Boston          12
  2      Natick          13
  4      Worcester       15
  2      Worcester       16
  4      Natick          17
  2      Boston          21
Separate the variable Snowfall into three variables, one for each town indicated in the variable Town. The output table is in unstacked format. Each row in U contains data from rows in S that have the same value in the grouping variable Storm. The order of the unique values in Storm determines the row order of the data in U.
U = unstack(S,"Snowfall","Town")
U=4×4 table Storm Boston Natick Worcester _____ ______ ______ _________
3 5 0 3
1 9 5 10
4 12 17 15
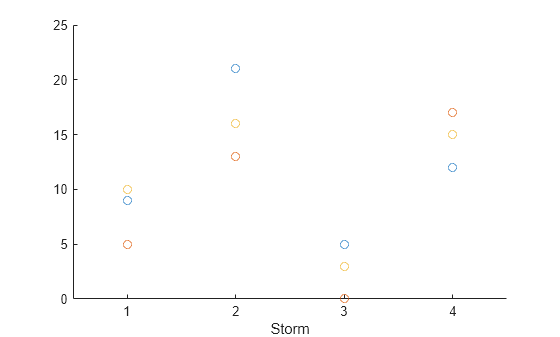
2 21 13 16 The unstacked format can be more convenient for some types of analysis and display. For example, now it is more straightforward to plot snowfall amounts for each town. To make a scatter plot of the snowfall amounts in each town, use the scatter function.
scatter(U,"Storm",["Boston" "Natick" "Worcester"])
Unstack data and apply an aggregation function to multiple rows in the same group that have the same values in the indicator variable. Also return the index vector as the second argument. Use it to index into the original stacked input table.
Load a timetable from the stockPricesSmall.mat sample file containing data on the price of two stocks over two days. The Stock variable has the categorical data type because this timetable has a fixed set of stock names.
load stockPricesSmall.mat S
S=11×2 timetable Date Stock Price ___________ ______ _____
12-Apr-2025    Stock1    60.35
12-Apr-2025    Stock2    27.68
12-Apr-2025    Stock1    64.19
12-Apr-2025    Stock2    25.47
12-Apr-2025    Stock2    28.11
12-Apr-2025    Stock2    27.98
15-Apr-2025    Stock1    63.85
15-Apr-2025    Stock2    27.55
15-Apr-2025    Stock2    26.43
15-Apr-2025    Stock1    65.73
15-Apr-2025    Stock2    25.94
S contains two prices for Stock1 during the first day and four prices for Stock2 during the first day.
Create a timetable that contains separate variables for each stock and one row for each day. Treat Date (the vector of row times) as the grouping variable and specify mean as the aggregation function. This operation unstacks prices from the Price variable, groups prices by date, and calculates the mean price for each stock on each day.
[U,is] = unstack(S,"Price","Stock", ... AggregationFunction=@mean)
U=2×2 timetable Date Stock1 Stock2 ___________ ______ ______
12-Apr-2025    62.27     27.31
15-Apr-2025    64.79     26.64
The second output is identifies the index of the first value for each group of rows in S. For example, the first value for the group with the date April 15, 2025, is in the seventh row of S.
ans=1×2 timetable Date Stock Price ___________ ______ _____
15-Apr-2025 Stock1 63.85Input Arguments
Input table, specified as a table or a timetable. The input must contain data variables to unstack and an indicator variable. The remaining variables can be treated as either grouping variables or constant variables.
Variables of the input to unstack, specified as a string array, character vector, cell array of character vectors, pattern scalar, positive integer, array of positive integers, or logical vector.
Example: U = unstack(S,"Var1","Var2") unstacks the variable Var1 of U usingVar2 as the indicator variable.
Example: U = unstack(S,["Var1" "Var3" "Var5"],"Var2") unstacks values of the variables Var1,Var3, and Var5 into many unstacked output variables. The number of output variables is determined by the number of unique values in Var2.
Example: U = unstack(S,1:4,5) unstacks the first four variables of U into many variables inS using the fifth variable as the indicator variable.
Indicator variable, specified as a string scalar, character vector, or positive integer. The values in ivar indicate which variables of the output receive unstacked data from the input.
The variable specified by ivar can be a numeric vector, logical vector, character array, cell array of character vectors, string array, or categorical vector.
Name-Value Arguments
Specify optional pairs of arguments asName1=Value1,...,NameN=ValueN, where Name is the argument name and Value is the corresponding value. Name-value arguments must appear after other arguments, but the order of the pairs does not matter.
Example: AggregationFunction=@mean applies the aggregation function mean to the values invars.
Grouping variables that define groups of rows of the input, specified as a string array, character vector, cell array of character vectors,pattern scalar, positive integer, array of positive integers, or logical vector. Each group of rows from the input becomes one row of the output.
If the grouping variables have missing values, thenunstack excludes the corresponding rows of the input table. It groups data and unstacks results without data from those rows. Missing values can be implemented by any data type (except for the integer and logical data types). Commonly used missing values include:
NaNs in numeric anddurationarraysNaTs indatetimearrays- missing strings in string array
- undefined values in categorical arrays
To include rows where the grouping variables have missing values, consider using the groupsummary function instead.
S can have row labels along its first dimension. IfS is a table, then it can have row names as the labels. If S is a timetable, then it must have row times as the labels. unstack can treat row labels as grouping variables.
- If you do not specify
GroupingVariablesandSis a timetable, thenunstacktreats the row times as a grouping variable. - If you specify
GroupingVariablesandShas row names or row times, thenunstackdoes not treat them as grouping variables, unless you include them inGroupingVariables.
Variables that are constant within a group, specified as a string array, character vector, cell array of character vectors, pattern scalar, positive integer, array of positive integers, or logical vector.
The values for these variables in the output are taken from the first row in each group in the input.
You can include the row names or row times of the input when you specify ConstantVariables.
If you do not specify ConstantVariables, thenunstack does not treat any variable as constant.
Names for the new data variables in the output, specified as a string array or cell array of character vectors.
If you do not specify NewDataVariableNames, thenunstack creates names for the new data variables in the output based on string representations of the values in the indicator variable ivar.
Aggregation function to apply to data variables, specified as a function handle. unstack applies this function to rows from the same group that have the same value inivar. The function must aggregate the data values into one output value.
If you do not specify AggregationFunction, thenunstack uses different default aggregation functions depending on data type.
- For numeric data, the default aggregation function is
sum. - For nonnumeric data, the default aggregation function is
unique.
If there are no data values to aggregate, because there are no data values corresponding to a given indicator value inivar after unstacking, thenunstack must fill an empty element in the unstacked output table. In that case, unstack either fills in a missing value or calls the user-supplied aggregation function with an empty array as input. In the latter case, the value that unstack fills in depends on what the aggregation function returns when there is no data to aggregate.
| Result When There Is No Data for Given Indicator Value | Fill Value Inserted into Empty Element of Unstacked Table |
|---|---|
| Aggregation function is one of the default functions. | Missing value of the appropriate data type, such as a NaN,NaT, missing string, or undefined categorical value. |
| Aggregation function is a user-supplied function. When given an empty array as input, it returns an empty array. | Missing value of the appropriate data type, such as a NaN,NaT, missing string, or undefined categorical value.Example: If the aggregation function is min, and it returns a 0-by-1 double array, thenunstack inserts aNaN into the output table. |
| Aggregation function is a user-supplied function. When given an empty array as input, it returns a scalar. | Scalar returned from the aggregation function.Example: If the aggregation function is numel and it returns0, thenunstack inserts a0 into the output table. |
| Aggregation function is a user-supplied function. It returns a vector, matrix, or multidimensional array. | unstack raises an error. |
| Aggregation function raises an error. | unstack raises the same error. |
Rule for naming variables of the output, specified as either"modify" or "preserve".
The VariableNamingRule argument specifies the following rules for naming variables in the output.
| Value ofVariableNamingRule | Rule |
|---|---|
| "modify" (default) | Modify names taken from the input table or timetable so that the corresponding variable names in the output are also valid MATLAB® identifiers. |
| "preserve" | Preserve original names taken from the input table or timetable. The corresponding variable names in the output can have any Unicode® characters, including spaces and non-ASCII characters.Note: In some cases,unstack must modify original names even when "preserve" is the rule. Such cases include:Duplicate namesNames that conflict with table dimension namesNames that conflict with a reserved name.Names whose lengths exceed the value ofnamelengthmax. |
Output Arguments
Output table, returned as a table or a timetable. The output contains the unstacked data variables, the grouping variables, and the first value of each group from any constant variables.
The order of the data in the output is based on the order of the unique values in the grouping variables.
You can store additional metadata such as descriptions, variable units, variable names, and row names in the output. For more information, see the Properties sections of table or timetable.
Row index to the input, returned as a column vector. For each row in the output, the index vector is identifies the index of the first value in the corresponding group of rows in the input.
More About
Grouping variables are utility variables used to group, or categorize, data. Grouping variables are useful for summarizing or visualizing data by group. You can define groups in your table by specifying one or more grouping variables.
A grouping variable can be any of the following:
- Categorical vector
- String array
- Cell array of character vectors
- Numeric vector, typically containing positive integers
- Logical vector
datetimeordurationvector
Rows where the grouping variables have the same values belong to the same group.
If the grouping variables have missing values, then unstack excludes the corresponding rows of the input table. It groups data and unstacks results without data from those rows. Missing values are values such asNaNs, NaTs, missing strings, and undefined categorical values.
Tips
- You can specify more than one data variable of the input, and each variable becomes a set of unstacked data variables in the output. Use a vector of positive integers, a cell array or string array containing multiple variable names, or a logical vector to specify
vars. The one indicator variable, specified by the input argumentivar, applies to all data variables specifies byvars.
Extended Capabilities
Usage notes and limitations:
- The
NewDataVariableNamesname-value argument must be specified. Its value must be constant. - The
varsandivarsinput arguments (data variables and indicator variables) must be constant. - If you specify grouping variables and constant variables, then they must be constant.
- If you specify an aggregation function, then it must be constant.
- If the input is a timetable with regular row times and you specify grouping variables that do not include the row times, then the output timetable might have irregular row times. Even though the intervals between output row times might look the same, the output timetable considers the vector of row times to be irregular.
- If a variable of the input table or timetable is a cell array of character vectors, then
unstackfills empty cells in the corresponding output variable with 1-by-0 character arrays in the generated code. In MATLAB,unstackfills such gaps with 0-by-0 character arrays. - The
unstackfunction does not support code generation when the input table or timetable has a variable that is a heterogeneous cell array that cannot be converted to a homogeneous cell array.- If the input has a variable that is a homogeneous cell array, or that can be converted to one, then the
AggregationFunctionname-value argument must be specified. The default value ofAggregationFunctionis"unique". But theuniquefunction does not support cell arrays.
- If the input has a variable that is a homogeneous cell array, or that can be converted to one, then the
- The
varsinput argument and theGroupingVariablesandConstantVariablesname-value arguments do not support pattern expressions.
Version History
Introduced in R2013b
In R2020a, if you do not specify the AggregationFunction name-value argument, then the default aggregation function for nonnumeric data is the unique function. In previous releases, there was no default aggregation function for nonnumeric data, so unstack would raise an error.
In R2020a, there are behavior changes when the aggregation function has no data to aggregate. This situation can occur when there are no data values that correspond to values in the indicator variable after unstacking. In such cases,unstack essentially calls the aggregation function on an empty array.
| Value Returned by Aggregation Function When No Data to Aggregate | Behavior in R2020a | Behavior in Previous Releases |
|---|---|---|
| Data variable is numeric and the aggregation function raises an error. | unstack raises an error. | unstack filled output table element with fill value that is appropriate for the data type (such asNaN for double arrays). |
| Data variable is nonnumeric and the aggregation function returns an empty array. | unstack fills output table element with fill value that is appropriate for the data type (such as"" for string arrays). | unstack raised an error. |
| Data variable is numeric and the aggregation function returns a scalar value (for example, numel returns 0). | unstack inserts value returned by the aggregation function. For example, if numel returns 0, then unstack inserts 0 into corresponding table element. | unstack fills output table element with fill value that is appropriate for the data type (such asNaN for double arrays). |
| Data variable is numeric and the aggregation function returns a vector, matrix, or multidimensional array. | unstack raises an error. | unstack fills output table element with fill value that is appropriate for the data type (such asNaN for double arrays). |