title - Add title - MATLAB (original) (raw)
Syntax
Description
title([titletext](#btpi3rq-1-txt)) adds the specified title to the current axes or standalone visualization. Reissuing thetitle command causes the new title to replace the old title.
title([titletext](#btpi3rq-1-txt),[subtitletext](#mw%5Ffe84c3e3-9402-4075-b695-48b1ac4ec71a)) adds a subtitle underneath the title.
title(___,[Name,Value](#namevaluepairarguments)) modifies the title appearance using one or more name-value pair arguments. For example, 'FontSize',12 sets the font size to 12 points. Specify name-value pair arguments after all other input arguments. Modifying the title appearance is not supported for all types of charts.
title([target](#btpi3rq-1-target),___) adds the title to the specified target object.
[t](#btpi3rq-1-t) = title(___) returns the object used for the title. Use t to make future modifications to the title.
[[t](#btpi3rq-1-t),[s](#mw%5F3f76aef5-3e98-44fe-b781-3294e88e3631)] = title(___) returns the objects used for the title and the subtitle. Use t to modify the title, and use s to modify the subtitle.
Examples
Create a figure and display a title in the current axes.
plot((1:10).^2) title('My Title')

You also can call title with a function that returns text. For example, the date function returns text with today's date.

MATLAB® sets the output of date as the axes title.
Create a plot. Then create a title and a subtitle by calling the title function with two character vectors as arguments. Use the 'Color' name-value pair argument to customize the color for both lines of text. Specify two return arguments to store the text objects for the title and subtitle.
plot([0 1]) [t,s] = title('Straight Line','Slope = 1, y-Intercept = 0',... 'Color','blue');

Change the font size for the title to 16, and change the font angle for the subtitle to 'italic'.
t.FontSize = 16; s.FontAngle = 'italic';

Include the value of variable c in a title.
figure plot((1:10).^2) f = 70; c = (f-32)/1.8; title(['Temperature is ',num2str(c),' C'])

Use the color modifier \color to change the color of characters following it from the previous color.
plot((1:10).^2) title(['\fontsize{16}black {\color{magenta}magenta '... '\color[rgb]{0 .5 .5}teal \color{red}red} black again'])

Create a plot, and define t as a character vector that includes LaTeX markup. Surround the markup with dollar signs ($). Then pass t to the title function, and set the Interpreter property to 'latex'.
x = 0:0.1:10; y = sin(x); dy = cos(x); plot(x,y,x,dy); t = '$sin(x)$ and ddxsin(x)\frac{d}{dx}sin(x)dxdsin(x)'; title(t,'interpreter','latex')

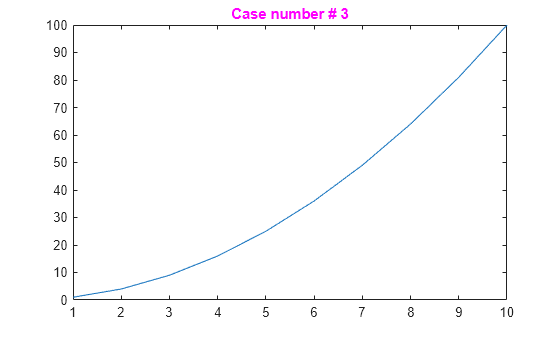
Use the Name,Value pair 'Color','m' to set the color of the title to magenta.
figure plot((1:10).^2) title('Case number # 3','Color', 'm')
Use TeX markup to include Greek symbols in a title.
t = (0:0.01:0.2); y = exp(-25*t); figure plot(t,y) title('y = \ite^{\lambda t}','Color','b')

The 'Interpreter' property must be 'tex' (the default).
figure plot((1:10).^2) title('\alpha^2 and X_1')
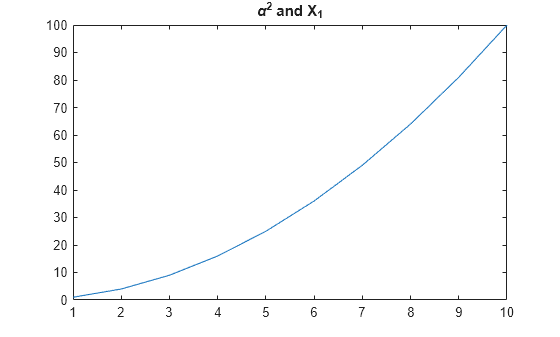
The superscript character, "^", and the subscript character, "_", modify the character or substring defined in braces immediately following.
Create a multiline title using a multiline cell array.
figure plot((1:10).^2) title({'First line';'Second line'})

Set the Interpreter property as 'none' so that the text X_1 is displayed in the figure as typed, without making 1 a subscript of X.
plot((1:10).^2) title('X_1','Interpreter','none')

Starting in R2019b, you can display a tiling of plots using the tiledlayout and nexttile functions. Call the tiledlayout function to create a 2-by-1 tiled chart layout. Call the nexttile function to create the axes objects ax1 and ax2. Then plot data into each axes.
tiledlayout(2,1) ax1 = nexttile; plot(ax1,(1:10).^2) ax2 = nexttile; plot(ax2,(1:10).^3)

Add a title to each axes by passing ax1 and ax2 to the title function.
title(ax1,'Top Plot') title(ax2,'Bottom Plot')

Add a title to a plot and return the text object.
plot((1:10).^2) t = title('My Title');

Set the color of the title to red. Use dot notation to set properties.

Create a plot with a title. Get the current axes, and then align the title to the left edge of the plot box by setting the TitleHorizontalAlignment property of the axes to 'left'.
plot([0 2],[1 5]) title('Straight Line') ax = gca; ax.TitleHorizontalAlignment = 'left';

Center the title setting the TitleHorizontalAlignment property on the axes to 'center'.
ax.TitleHorizontalAlignment = 'center';

Input Arguments
Title text, specified as a character vector, cell array of character vectors, string array, categorical array, or numeric value. Specify a value according to how you want the text to appear. This table lists the most common situations.
| Appearance of Text | Description of Value | Example |
|---|---|---|
| One line of text | Character vector or string scalar. | txt = 'My Text'ortxt = "My Text" |
| Multiple lines of text | Cell array of character vectors or string array. | txt = {'First line','Second line'};ortxt = ["First line", "Second line"]; |
| Text that includes a numeric variable | Array that includes the number converted to achar array. Use num2str to convert the value. | x = 42; txt = ['The value is ',num2str(x)]; |
| Text that includes special characters such as Greek letters or mathematical symbols | Array that includes TeX markup. For a list of supported markup, see theInterpreter property. | txt = 'x ranges from 0 to 2\pi' |
Note
- The words
default,factory, andremoveare reserved words that do not appear in text when quoted as normal characters. To display any of these words individually, precede them with a backslash, such as'\default'or'\remove'. - If you specify this property as a categorical array, MATLAB® uses the values in the array, not the categories.
- If you specify text that contains only a numeric value, the value is converted using
sprintf('%g',value). For example,12345678displays as1.23457e+07.
Subtitle text, specified as a character vector, cell array of character vectors, string array, categorical array, or numeric value. Specify a value according to how you want the text to appear. This table lists the most common situations.
| Appearance of Text | Description of Value | Example |
|---|---|---|
| One line of text | Character vector or string scalar. | txt = 'My Text'ortxt = "My Text" |
| Multiple lines of text | Cell array of character vectors or string array. | txt = {'First line','Second line'};ortxt = ["First line", "Second line"]; |
| Text that includes a numeric variable | Array that includes the number converted to achar array. Use num2str to convert the value. | x = 42; txt = ['The value is ',num2str(x)]; |
| Text that includes special characters such as Greek letters or mathematical symbols | Array that includes TeX markup. For a list of supported markup, see theInterpreter property. | txt = 'x ranges from 0 to 2\pi' |
Note
- The words
default,factory, andremoveare reserved words that do not appear in text when quoted as normal characters. To display any of these words individually, precede them with a backslash, such as'\default'or'\remove'. - If you specify this property as a categorical array, MATLAB uses the values in the array, not the categories.
- If you specify text that contains only a numeric value, the value is converted using
sprintf('%g',value). For example,12345678displays as1.23457e+07.
Target for the title, specified as one of the following:
- Any type of axes: an
Axes,PolarAxes, orGeographicAxesobject. - Any type of legend: a
LegendorBubbleLegendobject. - A
TiledChartLayoutobject. - A standalone visualization that has a
Titleproperty. For example, you can add a title to aHeatmapChartobject. - An array of graphics objects from the preceding list. The objects must belong to the same class. To determine the class, use the class function.
If you do not specify the target for the title, then the title function adds the title to the graphics object returned by the gca command.
Note
Some charts do not support modifying the title appearance, such as the color, or returning the text object as an output argument.
Name-Value Arguments
Specify optional pairs of arguments asName1=Value1,...,NameN=ValueN, where Name is the argument name and Value is the corresponding value. Name-value arguments must appear after other arguments, but the order of the pairs does not matter.
Before R2021a, use commas to separate each name and value, and enclose Name in quotes.
Example: 'Color','red','FontSize',14 adds a title with red, 14-point font.
In addition to the following, you can specify other text object properties using Name,Value pair arguments. See Text Properties.
Font size, specified as a scalar value greater than 0 in point units. One point equals 1/72 inch. To change the font units, use the FontUnits property.
If you add a title or subtitle to an axes object, then the font size property for the axes also affects the font size for the title and subtitle. The title and subtitle font sizes are the axes font size multiplied by a scale factor. The FontSize property of the axes contains the axes font size. The TitleFontSizeMultiplier property of the axes contains the scale factor. By default, the axes font size is 10 points and the scale factor is 1.1, so the title and subtitle each have a font size of 11 points.
Data Types: single | double | int8 | int16 | int32 | int64 | uint8 | uint16 | uint32 | uint64
Thickness of the text characters, specified as one of these values:
'normal'— Normal weight as defined by the particular font'bold'— Thicker characters outlines than normal
MATLAB uses the FontWeight property to select a font from those available on your system. Not all fonts have a bold font weight. Therefore, specifying a bold font weight could still result in the normal font weight.
The TitleFontWeight property for the associated axes affects the FontWeight value for the title. Similarly, theSubtitleFontWeight property for the associated axes affects the FontWeight value for the subtitle.
Note
The 'light' and 'demi' font weight values have been removed. Use 'normal' instead.
Output Arguments
Object used for the title, returned as one of these types of objects:
- Text object — If you add a title to axes, then
titlereturns a text object. Use this text object to access and modify properties of the title after it is created. For a list of text object properties, seeText Properties. You also can access the title through the Title property of the axes object. - Legend text object — If you add a title to a legend, then
titlereturns a legend text object. Use this legend text object to access and modify properties of the title after it is created. For a list of legend text object properties, see Text Properties. You also can access the title through the Title property of the legend object.
Object used for the subtitle, returned as a text object. Use this text object to modify properties of the subtitle after creating it. For a list of text object properties, see Text Properties. You also can access the subtitle through the Subtitle property of the axes object.
Tips
- By default, the
Interactionsproperty containseditInteractionso the text can be edited by clicking on the text. To disable this interaction, set theInteractionsproperty of the text object to[].
Version History
Introduced before R2006a