uitree - Create tree or check box tree component - MATLAB (original) (raw)
Create tree or check box tree component
Syntax
Description
`t` = uitree creates a standard tree in a new figure window and returns the Tree object. MATLAB® calls the uifigure function to create the figure.
`t` = uitree([style](#mw%5F7f9e407c-a764-4eef-b45b-0f617000e142)) creates a tree of the specified style. Specify style as'checkbox' to create a check box tree instead of a standard one.
`t` = uitree([parent](#mw%5Faf1e3853-b578-44e8-a0c0-cc8c7edf0764%5Fsep%5Fmw%5Fa6330465-2069-40e4-857c-69da4d660066)) creates a standard tree in the specified parent container. The parent can be aFigure object or one of its child containers.
`t` = uitree([parent](#mw%5Faf1e3853-b578-44e8-a0c0-cc8c7edf0764%5Fsep%5Fmw%5Fa6330465-2069-40e4-857c-69da4d660066),[style](#mw%5F7f9e407c-a764-4eef-b45b-0f617000e142)) creates a tree of the specified style in the specified parent container.
`t` = uitree(___,[Name,Value](#namevaluepairarguments)) creates a tree with properties specified by one or moreName,Value arguments. Use this option with any of the input argument combinations in the previous syntaxes.
Examples
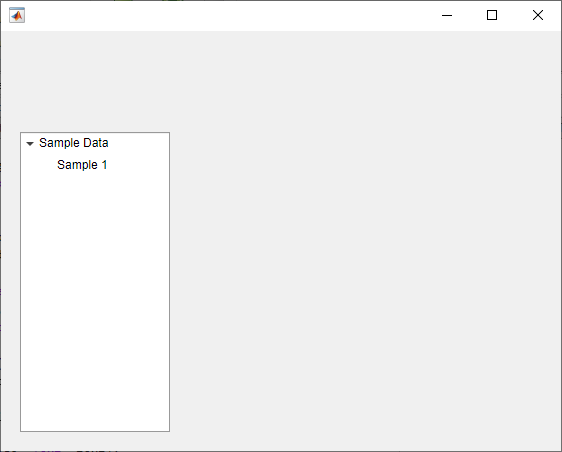
Create a tree that contains a parent node called Sample Data with a child node called Sample 1. Expand the tree to see both nodes.
fig = uifigure; t = uitree(fig); parent = uitreenode(t,'Text','Sample Data'); child = uitreenode(parent,'Text','Sample 1'); expand(t)
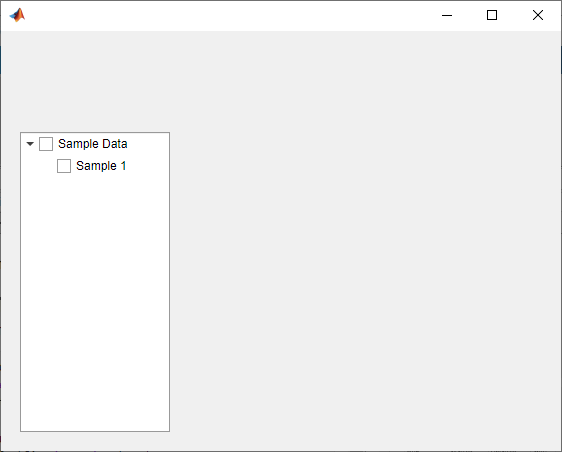
Create a check box tree that contains a parent node calledSample Data with a child node calledSample 1. Expand the tree to see both nodes.
fig = uifigure; t = uitree(fig,'checkbox'); parent = uitreenode(t,'Text','Sample Data'); child = uitreenode(parent,'Text','Sample 1'); expand(t)
Style nodes in a tree that showcases a file structure to visually distinguish different file types.
Create a tree UI component. Each top-level node represents a folder. Each child node represents a file in that folder. Expand the tree to see all the nodes.
fig = uifigure("Position",[300 300 350 400]); t = uitree(fig);
% Parent nodes n1 = uitreenode(t,"Text","App 1"); n2 = uitreenode(t,"Text","App 2"); n3 = uitreenode(t,"Text","Images");
% Child nodes n11 = uitreenode(n1,"Text","myapp1.m"); n21 = uitreenode(n2,"Text","myapp2.m"); n22 = uitreenode(n2,"Text","app2callback.m"); n31 = uitreenode(n3,"Text","peppers.png");
expand(t)

Create three styles: one with a bold font weight, one with an italic font angle, and one with an icon.
dirStyle = uistyle("FontWeight","bold"); mStyle = uistyle("FontAngle","italic"); imgStyle = uistyle("Icon","peppers.png");
Apply the bold style to the top-level nodes to distinguish the nodes that represent folders. Apply the italic style to the children of the App 1 and App 2 nodes to distinguish the nodes that represent MATLAB program files. Finally, apply the icon style to the node that represents an image file to show a preview of the image.
addStyle(t,dirStyle,"level",1) addStyle(t,mStyle,"node",[n1.Children;n2.Children]) addStyle(t,imgStyle,"node",n31)

Create an app that displays athlete names grouped by sport. When the app user clicks on a name, MATLAB displays data about the athlete.
Create a program file called mytreeapp.m that contains the following commands to create a tree, a set of nested tree nodes, and a callback function for the tree. The SelectionChangedFcn property specifies the function to execute when the user clicks a node in the tree.
function mytreeapp fig = uifigure; t = uitree(fig,"Position",[20 20 150 150]);
% Assign callback in response to node selection
t.SelectionChangedFcn = @nodechange;

% First level nodes
category1 = uitreenode(t,"Text","Runners","NodeData",[]);
category2 = uitreenode(t,"Text","Cyclists","NodeData",[]);

% Second level nodes.
% Node data is age (y), height (m), weight (kg)
p1 = uitreenode(category1,"Text","Joe","NodeData",[40 1.67 58] );
p2 = uitreenode(category1,"Text","Linda","NodeData",[49 1.83 90]);
p3 = uitreenode(category2,"Text","Rajeev","NodeData",[25 1.47 53]);
p4 = uitreenode(category2,"Text","Anne","NodeData",[88 1.92 100]);

% Expand the tree
expand(t);

% Create the function for the SelectionChangedFcn callback
% When the function is executed, it displays the data of the selected item
function nodechange(src,event)
    node = event.SelectedNodes;
    display(node.NodeData);
end
end
When the user runs mytreeapp and clicks a node in the tree, MATLAB displays the NodeData for that node.

Create an app that displays a grocery list grouped by food category. The app user can check individual items or entire food categories, and MATLAB displays the total weight of the checked items.
Create a program file called mycheckboxtreeapp.m that contains the following commands to create a check box tree, a set of nested tree nodes, and two callback functions for the check box tree. TheCheckedNodesChangedFcn property specifies the function to execute when the user checks or clears a node in the tree. TheSelectedNodesChangedFcn property specifies the function to execute when the user selects a node in the tree.
function mycheckboxtreeapp fig = uifigure; cbt = uitree(fig,'checkbox','Position',[20 20 150 150]);
% Assign callbacks in response to node check and selection
cbt.CheckedNodesChangedFcn = @checkchange;
cbt.SelectionChangedFcn = @selectchange;

% First level nodes
category1 = uitreenode(cbt,'Text','Vegetables','NodeData',[]);
category2 = uitreenode(cbt,'Text','Fruits','NodeData',[]);

% Second level nodes.
% Node data is the weight of the food item (in grams)
p1 = uitreenode(category1,'Text','Cucumber','NodeData',400);
p2 = uitreenode(category1,'Text','Carrot','NodeData',65);
p3 = uitreenode(category2,'Text','Apple','NodeData',183);
p4 = uitreenode(category2,'Text','Banana','NodeData',120);

% Expand the tree
expand(cbt);

% Create the function for the CheckedNodesChangedFcn callback
% When this function is executed, it displays the total weight
% of all checked items
function checkchange(src,event)
    nodes = event.LeafCheckedNodes;
    if ~isempty(nodes)
        data = [nodes.NodeData];
        display(sum(data));
    end
end

% Create the function for the SelectedNodesChangedFcn callback
% When this function is executed, it displays the name
% of the selected item
function selectchange(src,event)
    node = event.SelectedNodes;
    display(node.Text);
end
end
When the user runs mycheckboxtreeapp and checks or clears a node in the tree, MATLAB displays the sum of the weights (stored inNodeData) for all the second-level checked nodes. When the user selects a node in the tree, MATLAB displays the text of that node.
Create a tree that populates nodes based on the data in a table.
Create a figure with a grid layout manager to hold the UI components. Load sample data on electric utility outages and create a table UI component to display the data. Then, create a tree to hold nodes listing the regions and causes of the outages.
fig = uifigure; gl = uigridlayout(fig,[1 2]); gl.ColumnWidth = {'2x','1x'};
T = readtable("outages.csv"); T = T(1:20,["Region","OutageTime","Loss","Cause"]); tbl = uitable(gl,"Data",T);
tr = uitree(gl);
Specify the table variables to display in the tree. For each of those variables, create a top-level node whose text is the variable name. Extract the relevant data by converting the table entries for the variable to a categorical array and returning the list of categories as names. Then, loop through the categories. For each element, add a node to the tree under the appropriate parent node.
vars = ["Region","Cause"];
for k1 = 1:length(vars) var = vars{k1}; varnode = uitreenode(tr,"Text",var); rows = T{:,var}; names = categories(categorical(rows));
for k2 = 1:length(names)
    text = names{k2};
    uitreenode(varnode,"Text",text);
end
end
Expand the tree to see all the nodes.

Input Arguments
Style of tree, specified as one of the following:
'tree'— Hierarchical list of items'checkbox'— Hierarchical list of items that can be checked, presented with a check box to the left of each item
Parent container, specified as a Figure object or one of its child containers: Tab, Panel, ButtonGroup, orGridLayout. If you do not specify a parent container, MATLAB calls the uifigure function to create a new Figure object that serves as the parent container.
Name-Value Arguments
Specify optional comma-separated pairs of Name,Value arguments. Name is the argument name and Value is the corresponding value. Name must appear inside single quotes (' '). You can specify several name and value pair arguments as Name1,Value1,...,NameN,ValueN.
Each type of Tree object supports a different set of properties. For a full list of properties and descriptions for each type, see the associated property page.
- If
styleis the default,'tree', seeTree. - If
styleis'checkbox', seeCheckBoxTree.
More About
In a standard tree or a check box tree, a selected node is indicated by a blue highlight around the node text. The app user can select a node by clicking on the node text.
In a standard tree with the Multiselect property set to'off' and in every check box tree, at most one node can be selected at any time. In a standard tree, you can set theMultiselect property to 'on' to allow for multiple nodes to be selected.
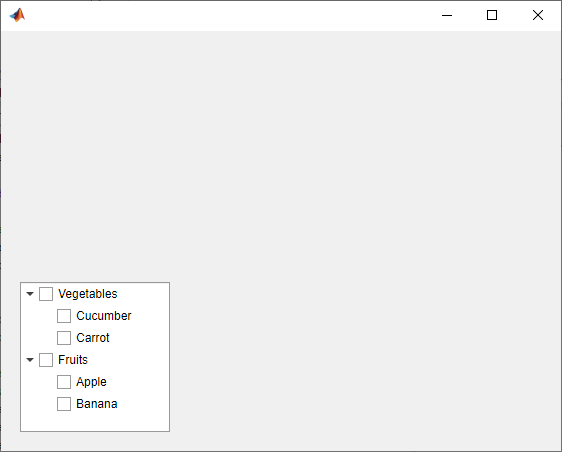
In this image, the Carrot node is selected.

In a check box tree, a checked node is indicated by a checked check box to the left of the node text. Any number of nodes can be checked. The app user can check or clear a node by clicking on the check box. In a standard tree, you cannot check nodes.
In this image, the Fruits, Apple, andBanana nodes are checked.
Version History
Introduced in R2017b
Use the ClickedFcn and DoubleClickedFcn callback properties to program a response to a user clicking and double-clicking the tree.
For more information, see Tree or CheckBoxTree.
Create trees with a check box to the left of every item by specifying the tree style as'checkbox':
fig = uifigure; t = uitree(fig,'checkbox'); n1 = uitreenode(t); n2 = uitreenode(t);
Check box trees allow for easier selection of multiple tree nodes.