Display Signal Attributes - MATLAB & Simulink (original) (raw)
A signal line in a model has attributes such as data type, dimensions, and numeric complexity. When you display these attributes on the block diagram, you can:
- Make the model easier to understand by others.
- Determine the value of the attribute that the signal ultimately uses for simulation (for example, when a signal uses an inherited data type).
- Plan your strategy to control these attributes along a data path (a series of connected blocks).
Additionally, to inspect and specify these attributes in a searchable, sortable table, you can use the Model Data Editor.
Ports & Signals Menu
In the Simulink® Editor, on the Debug tab, the menu offers the following options for displaying signal properties on the block diagram:
- Linearization Indicators
- Port Data Types (See Port Data Types)
- Design Ranges (See Design Ranges)
- Signal Dimensions (See Signal Dimensions)
- Storage Class
- Testpoint/Logging Indicators
- Signal Resolution Indicators (See Signal to Object Resolution Indicator)
- Viewer Indicators
- Wide Nonscalar Lines (See Wide Nonscalar Lines)
In addition, you can display sample time information. In the Simulink Editor, on the Debug tab, the menu provides the choices of and . The option allows the block diagram signal lines and blocks to be color-coded based on the sample time types and relative rates. The option provides black codes on the signal lines which indicate the type of sample time. If you select both and , then both the colors and the annotations display. All of these options cause a Sample Time Legend to appear. The legend contains a description of the type of sample time and the sample time rate. If is enabled, color codes also appear in the legend. The same is true if is enabled.
Port Data Types
Displays the data type that each signal uses for simulation and code generation. The data type appears next to the output port that emits the signal.
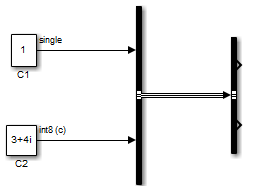
The notation (c) indicates that the signal is numerically complex (i).
If you use data type aliases (such as a Simulink.AliasType objects in the base workspace or a data dictionary) to set output data types in your model, by default, the diagram displays the aliases.

If you create a chain of aliases (for example, by using one Simulink.AliasType object as the base type of another Simulink.AliasType object), the diagram displays only the alias that you use to set the output data type of each signal. The diagram does not display the underlying aliases in the chain.
To display the lowest underlying base data type (such asint8, single, ors16En14) as well as the alias, in theDebug tab, open the Information Overlays drop-down. Under Ports clickBase Data Types and Alias Data Types.

Alternatively, you can display the base type and not the alias by selectingBase Data Types.
When you use a fixed-point data type, the diagram displays the base type by using a standard notation that indicates the characteristics of the type (such as signedness and binary fraction length). To interpret this notation, see Fixed-Point Data Type and Scaling Notation (Fixed-Point Designer).
When you save a model with Base Data Types enabled, the next time you load the model, it displays the data type and complexity signal attributes.
Design Ranges
Displays the compiled design range of a signal next to the output port that emits the signal. The ranges are computed during an update diagram.
![In this model, output dimension of a Mux block is displayed as [min..max], where min indicates the minimum design dimension of the input signals and max indicates the maximum design dimension of the Mux output.](https://in.mathworks.com/help/simulink/ug/display_design_range.png)
Ranges are displayed in the format [min..max]. In the above example, the design range at the output port of the Mux block is displayed as [-10..mixed], because the two signals the Mux block combines have the same design minimum but different design maximums.
You can also use command-line parametersCompiledPortDesignMin andCompiledPortDesignMax to access the design minimum and maximum of port signals, respectively, at compile time. For more information, see Common Block Properties.
Signal Dimensions
Display the dimensions of nonscalar signals next to the line that carries the signal.

The format of the display depends on whether the line represents a single signal or a bus. If the line represents a single vector signal, Simulink displays the width of the signal. If the line represents a single matrix signal, Simulink displays its dimensions as [N1xN2] whereNi is the size of the ith dimension of the signal. If the line represents a bus carrying signals of the same data type, Simulink displays N{M} where N is the number of signals carried by the bus and M is the total number of signal elements carried by the bus. If the bus carries signals of different data types, Simulink displays only the total number of signal elements{M}.
To display signal dimensions, in the Debug tab, open the Information Overlays drop-down. UnderSignals click Signal Dimensions.
When you save a model with this option enabled, update (Ctrl+D) or simulate (Ctrl+T) the model next time you load it to view signal dimensions.
Note
For versions R2024a or later, a scalar signal characterized by a matrix of size 1-by-1 is displayed as[1x1].
Signal to Object Resolution Indicator
The Simulink Editor by default graphically indicates signals that must resolve to signal objects. For any labeled signal whose Signal name must resolve to signal object property is enabled, a signal resolution icon appears to the left of the signal name. The icon looks like this:
![]()
A signal resolution icon indicates only that the Signal name must resolve to signal object property for a signal is enabled. The icon does not indicate whether the signal is actually resolved, and does not appear on a signal that is implicitly resolved without its Signal name must resolve to signal object property being enabled.
Where multiple labels exist, each label displays a signal resolution icon. No icon appears on an unlabeled branch. In the next figure, signalx2 must resolve to a signal object, so a signal resolution icon appears to the left of the signal name in each label:
![]()
To suppress the display of signal resolution icons, in the model window, on the Debug tab, select > to disable. This option is enabled default. To restore signal resolution icons, enable . Individual signals cannot be set to show or hide signal resolution indicators independently of the setting for the whole model. For additional information, see:
Wide Nonscalar Lines
Draws lines that carry vector or matrix signals wider than lines that carry scalar signals.

For more information on vector and matrix signals, see Signal Types.