Use Simulink Coverage to Analyze Your Model - MATLAB & Simulink (original) (raw)
Main Content
Use Simulink® Coverage™ to gain insight into which parts of your model are exercised during simulation to uncover bugs in your model or gaps in your testing. Your workflow usually looks like:
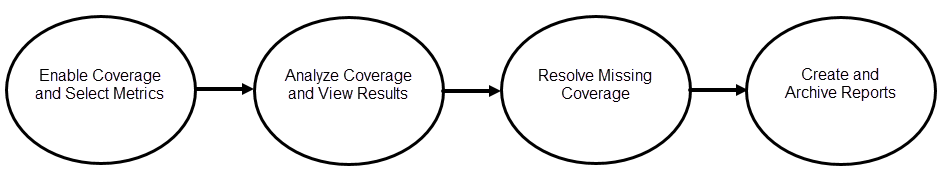
Enable Coverage and Select Metrics
First, you need to enable coverage and select the coverage metrics that best apply to your model. For more information about selecting metrics, see Enable Coverage and Select Metrics. For detailed information about specific blocks, see Model Objects That Receive Coverage.
Analyze Coverage and View Results
When you simulate your model with coverage enabled, Simulink Coverage reports on, and highlights, the model elements that are exercised during simulation. Use the model coloring in Simulink and the Coverage Details pane to browse the coverage results. You can also use the Coverage Results Explorer to look at individual tests and aggregated coverage and see which tests exercise which model elements. Coverage aggregation, which is also called cumulative coverage, allows you to run multiple tests, each of which might target a specific part of your model, and then combine the coverage from each of your simulations into a single report.
Address Missing Coverage
After you view your model coverage results, you might find that your model does not have 100% coverage. You can increase your model coverage by:
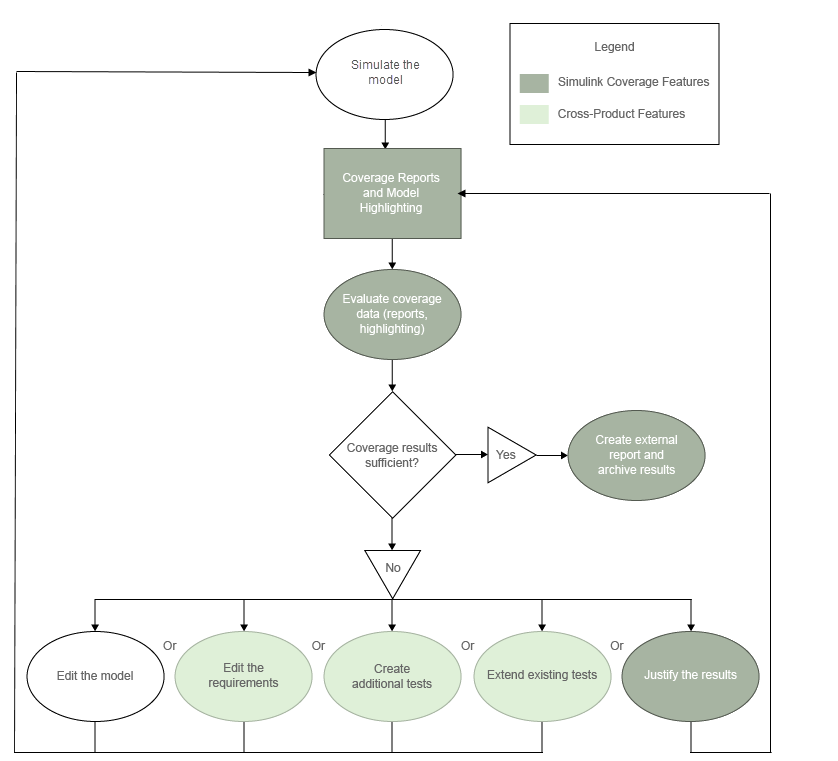
- Editing the model — Your model might contain unintended functionality that is not part of your required design. Remove the unintended functionality.
- Editing the requirements — You might have an incorrect requirement or a missing requirement. You can useRequirements Toolbox™ to author and edit requirements in Simulink. If you add a requirement, you must add a test case for that requirement. For more information, see Test Model Against Requirements and Report Results.
- Editing the tests — Your existing tests might not fully exercise the intended simulation inputs. You can use Simulink Coverage to create additional tests to model these inputs. For more information, see Automating Model Coverage Tasks and Generate Test Cases (Simulink Design Verifier). If you have a Simulink Design Verifier™ license, you may be able to automatically generate additional tests to exercise untested parts of your design. For more information, see Generate Tests to Increase Model Coverage.
- Filtering missing coverage results — Parts of your model might not be exercised during simulation according to your design, such as subsystems that only activate during failures. To achieve full coverage in such cases, you can filter out results for model elements you do not intend to exercise. For more information, seeCreate, Edit, and View Coverage Filter Rules.
Create and Archive Reports
After collecting coverage and addressing unsatisfied outcomes, you can create HTML reports for archiving results. In the Coverage Results Explorer, you can create a report from the aggregated coverage results or from individual test cases.
When you create a standalone coverage report, by default, the coverage tables list the satisfied and unsatisfied outcomes for only the model elements that have incomplete coverage. This is different than the report displayed in theCoverage Details pane, which shows the coverage tables by default. You can change the report settings in the Configuration Parameters window or in the Coverage Results Explorer. See Access, Manage, and Aggregate Coverage Results for more information.
To get started with this tutorial, see
- STEP 1: Enable Coverage and Select Metrics
- STEP 2: Analyze Coverage and View Results
- STEP 3: Address Missing Coverage
- STEP 4: Create and Archive Reports