View Coverage Results for Custom C/C++ Code in S-Function Blocks - MATLAB & Simulink (original) (raw)
Main Content
This example shows how to view coverage results for the C/C++ code in S-Function blocks in your model. To view coverage results for the C/C++ code in the blocks:
- Enable support for S-Function coverage. For more information, seeCoverage for Custom C/C++ Code in Simulink Models.
- Run simulation and view the coverage report.
The coverage results for S-Function blocks can be viewed in the same report as the rest of the model. For each S-Function block, the report links to a detailed coverage report for the C/C++ code in the block.
To view the full code coverage report used in this example, follow the steps inCoverage for S-Functions.
- In the coverage report, view the coverage metrics for theS-Function block.

For more information on the coverage report format, see Top-Level Model Coverage Report. - Select the Detailed Report link. The code coverage report for the S-Function block opens.
- Select each of the links in Table Of Contents to navigate to various sections of the report.

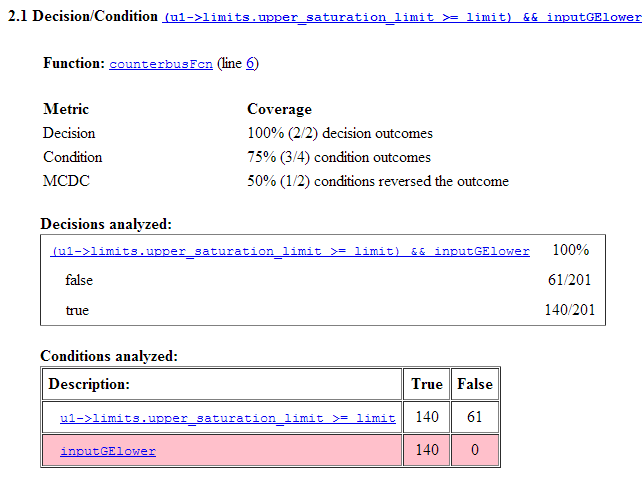
Section Title Purpose Analysis information Contains information such as time when model was created and last modified, and file size. Tests Contains information about the simulation such as start and end time. Summary Contains coverage information about the files and functions in the S-Function block. For each file and function, the percentage coverage is displayed. The coverage types relevant for the code are the following: Coverage Type Label Cyclomatic Complexity Complexity Condition Coverage Condition. Decision Coverage Decision Modified Condition/Decision Coverage (MCDC) MCDC Relational Boundary Coverage Relational Boundary Percentage of statements covered Stmt Details Contains coverage information about the statements that receive condition, decision or MCDC coverage. The information is grouped by file and function. Code Contains the C/C++ code. Statements that are not covered are highlighted in pink. - In the Summary section, select each file or function name to see details of coverage for statements in the file or function.

- The condition, decision or MCDC outcomes that were not tested during simulation are highlighted in pink. Within the details for a file or function, scroll down to note these cases and investigate them further.
- To obtain an overview of the statements that were not covered, navigate to the Code section. This section contains your code with the uncovered statements highlighted in pink.
