detect - Detect objects using YOLO v3 object detector - MATLAB (original) (raw)
Detect objects using YOLO v3 object detector
Since R2021a
Syntax
Description
[bboxes](#mw%5F347248b7-bae9-484e-922d-fb43fb242335) = detect([detector](#mw%5Fb2527f90-f19b-4f17-a725-3e336cac05b6%5Fsep%5Fmw%5Fe73e8606-1a99-4990-ab67-73fb04ab7614),[I](#mw%5Fb2527f90-f19b-4f17-a725-3e336cac05b6%5Fsep%5Fmw%5F555b0ab4-1847-4c0d-abf1-df4a8a70d9dd)) detects objects within a single image or an array of images, I, using a you only look once version 3 (YOLO v3) object detector, detector. The input size of the image must be greater than or equal to the network input size of the pretrained detector. The locations of objects detected are returned as a set of bounding boxes.
Note
To use the pretrained YOLO v3 object detection networks trained on COCO dataset, you must install the Computer Vision Toolbox™ Model for YOLO v3 Object Detection. You can download and install the Computer Vision Toolbox Model for YOLO v3 Object Detection from Add-On Explorer. For more information about installing add-ons, see Get and Manage Add-Ons. To run this function, you will require the Deep Learning Toolbox™.
[[bboxes](#mw%5F347248b7-bae9-484e-922d-fb43fb242335),[scores](#mw%5F21474b24-d0ce-4300-80e5-de3dc7ed32fd)] = detect([detector](#mw%5Fb2527f90-f19b-4f17-a725-3e336cac05b6%5Fsep%5Fmw%5Fe73e8606-1a99-4990-ab67-73fb04ab7614),[I](#mw%5Fb2527f90-f19b-4f17-a725-3e336cac05b6%5Fsep%5Fmw%5F555b0ab4-1847-4c0d-abf1-df4a8a70d9dd)) also returns the class-specific confidence scores for each bounding box.
[[bboxes](#mw%5F347248b7-bae9-484e-922d-fb43fb242335),[scores](#mw%5F21474b24-d0ce-4300-80e5-de3dc7ed32fd),[labels](#mw%5Fb2527f90-f19b-4f17-a725-3e336cac05b6%5Fsep%5Fmw%5F012877ad-dfdf-403b-a32b-26e83db49719)] = detect([detector](#mw%5Fb2527f90-f19b-4f17-a725-3e336cac05b6%5Fsep%5Fmw%5Fe73e8606-1a99-4990-ab67-73fb04ab7614),[I](#mw%5Fb2527f90-f19b-4f17-a725-3e336cac05b6%5Fsep%5Fmw%5F555b0ab4-1847-4c0d-abf1-df4a8a70d9dd)) returns a categorical array of labels assigned to the bounding boxes. The labels for object classes are defined during training.
[[bboxes](#mw%5F347248b7-bae9-484e-922d-fb43fb242335),[scores](#mw%5F21474b24-d0ce-4300-80e5-de3dc7ed32fd),[labels](#mw%5Fb2527f90-f19b-4f17-a725-3e336cac05b6%5Fsep%5Fmw%5F012877ad-dfdf-403b-a32b-26e83db49719),[info](#mw%5F4eca8dc4-6a7e-450e-9844-c484b4468c21)] = detect([detector](#mw%5Fb2527f90-f19b-4f17-a725-3e336cac05b6%5Fsep%5Fmw%5Fe73e8606-1a99-4990-ab67-73fb04ab7614),[I](#mw%5Fb2527f90-f19b-4f17-a725-3e336cac05b6%5Fsep%5Fmw%5F555b0ab4-1847-4c0d-abf1-df4a8a70d9dd)) also returns information about the class probabilities and objectness scores for each detection.
[detectionResults](#mw%5Fb2527f90-f19b-4f17-a725-3e336cac05b6%5Fsep%5Fmw%5F35eaeb44-3131-4ccd-8f5a-059229ed3e62) = detect([detector](#mw%5Fb2527f90-f19b-4f17-a725-3e336cac05b6%5Fsep%5Fmw%5Fe73e8606-1a99-4990-ab67-73fb04ab7614),[ds](#mw%5Fb2527f90-f19b-4f17-a725-3e336cac05b6%5Fsep%5Fmw%5F1b7e9f56-be71-4883-8fc6-9cf0e1af46f7)) detects objects within all the images returned by the read function of the input datastore ds.
[___] = detect(___,[roi](#mw%5Fb2527f90-f19b-4f17-a725-3e336cac05b6%5Fsep%5Fmw%5F01e52969-0a81-411e-bedb-c710e91786d0)) detects objects within the rectangular search region roi, in addition to any combination of arguments from previous syntaxes.
[___] = detect(___,[Name=Value](#namevaluepairarguments)) specifies options using one or more name-value arguments, in addition to any combination of arguments from previous syntaxes.
Examples
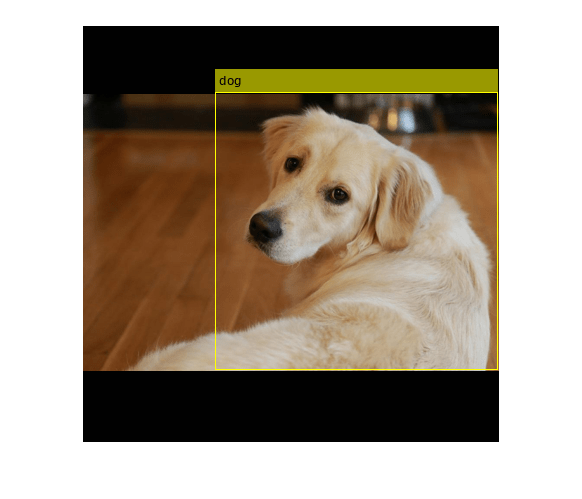
Load a pretrained YOLO v3 object detector.
detector = yolov3ObjectDetector('tiny-yolov3-coco');
Read a test image and preprocess the test image by using the preprocess function.
img = imread('sherlock.jpg'); img = preprocess(detector,img);
Detect objects in the test image.
[bboxes,scores,labels] = detect(detector,img);
Display the detection results.
results = table(bboxes,labels,scores)
results=1×3 table bboxes labels scores ________________________ ______ _______
133 67 283 278 dog 0.51771detectedImg = insertObjectAnnotation(img,'Rectangle',bboxes,labels); figure imshow(detectedImg)
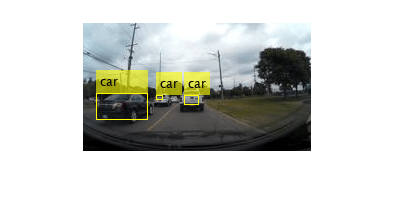
Load a pretrained YOLOv3 object detector.
detector = yolov3ObjectDetector('tiny-yolov3-coco');
Read the test data and store as an image datastore object.
location = fullfile(matlabroot,'toolbox','vision','visiondata','vehicles'); imds = imageDatastore(location);
Detect objects in the test dataset. Set the Threshold parameter value to 0.3 and MiniBatchSize parameter value to 32.
detectionResults = detect(detector,imds,'Threshold',0.3,'MiniBatchSize',32);
Read an image from the test dataset and extract the corresponding detection results.
num = 10; I = readimage(imds,num); bboxes = detectionResults.Boxes{num}; labels = detectionResults.Labels{num}; scores = detectionResults.Scores{num};
Perform non-maximal suppression to select strongest bounding boxes from the overlapping clusters. Set the OverlapThreshold parameter value to 0.2.
[bboxes,scores,labels] = selectStrongestBboxMulticlass(bboxes,scores,labels,'OverlapThreshold',0.2);
Display the detection results.
results = table(bboxes,labels,scores)
results=3×3 table bboxes labels scores ________________________ ______ _______
 14     71     52     27     car      0.93352
 74     73      7      5     car      0.65369
102     73     15     10     car      0.85313
detectedImg = insertObjectAnnotation(I,'Rectangle',bboxes,labels); figure imshow(detectedImg)
Load a pretrained YOLO v3 object detector.
detector = yolov3ObjectDetector('tiny-yolov3-coco');
Read a test image.
img = imread('highway.png');
Specify a region of interest (ROI) within the test image.
roiBox = [70 40 100 100];
Detect objects within the specified ROI.
[bboxes,scores,labels] = detect(detector,img,roiBox);
Display the ROI and the detection results.
img = insertObjectAnnotation(img,'Rectangle',roiBox,'ROI','AnnotationColor',"blue"); detectedImg = insertObjectAnnotation(img,'Rectangle',bboxes,labels); figure imshow(detectedImg)

Input Arguments
Test images, specified as a numeric array of size_H_-by-W_-by_C or_H_-by-_W_-by_C_-by-T. Images must be real, nonsparse, grayscale or RGB image.
- H: Height
- W: Width
- C: The channel size in each image must be equal to the network's input channel size. For example, for grayscale images,C must be equal to
1. For RGB color images, it must be equal to3. - T: Number of test images in the array. The function computes the object detection results for each test image in the array.
The intensity range of the test image must be similar to the intensity range of the images used to train the detector. For example, if you train the detector onuint8 images, rescale the test image to the range [0, 255] by using the im2uint8 or rescale function. The size of the test image must be comparable to the sizes of the images used in training. If these sizes are very different, the detector has difficulty detecting objects because the scale of the objects in the test image differs from the scale of the objects the detector was trained to identify.
Data Types: uint8 | uint16 | int16 | double | single
Test images, specified as a ImageDatastore object,CombinedDatastore object, orTransformedDatastore object containing full filenames of the test images. The images in the datastore must be grayscale, or RGB images.
Search region of interest, specified as an [x y width _height_] vector. The vector specifies the upper left corner and size of a region in pixels.
Name-Value Arguments
Specify optional pairs of arguments asName1=Value1,...,NameN=ValueN, where Name is the argument name and Value is the corresponding value. Name-value arguments must appear after other arguments, but the order of the pairs does not matter.
Example: detect(detector,I,Threshold=0.25)
Detection threshold, specified as a comma-separated pair consisting of'Threshold' and a scalar in the range [0, 1]. Detections that have scores less than this threshold value are removed. To reduce false positives, increase this value.
Select the strongest bounding box for each detected object, specified as the comma-separated pair consisting of 'SelectStrongest' and eithertrue or false.
true— Returns the strongest bounding box per object. The method calls the selectStrongestBboxMulticlass function, which uses nonmaximal suppression to eliminate overlapping bounding boxes based on their confidence scores.
By default, the selectStrongestBboxMulticlass function is called as follows
selectStrongestBboxMulticlass(bboxes,scores,...
'RatioType','Union',...
'OverlapThreshold',0.5);false— Return all the detected bounding boxes. You can then write your own custom method to eliminate overlapping bounding boxes.
Minimum region size, specified as the comma-separated pair consisting of'MinSize' and a vector of the form [height _width_]. Units are in pixels. The minimum region size defines the size of the smallest region containing the object.
By default, MinSize is 1-by-1.
Maximum region size, specified as the comma-separated pair consisting of'MaxSize' and a vector of the form [height _width_]. Units are in pixels. The maximum region size defines the size of the largest region containing the object.
By default, 'MaxSize' is set to the height and width of the input image, I. To reduce computation time, set this value to the known maximum region size for the objects that can be detected in the input test image.
Minimum batch size, specified as the comma-separated pair consisting of'MiniBatchSize' and a scalar value. Use theMiniBatchSize to process a large collection of image. Images are grouped into minibatches and processed as a batch, which can improve computational efficiency at the cost of increased memory demand. Decrease the size to use less memory.
Hardware resource on which to run the detector, specified as the comma-separated pair consisting of 'ExecutionEnvironment' and'auto', 'gpu', or 'cpu'.
'auto'— Use a GPU if it is available. Otherwise, use the CPU.'gpu'— Use the GPU. To use a GPU, you must have Parallel Computing Toolbox™ and a CUDA®-enabled NVIDIA® GPU. If a suitable GPU is not available, the function returns an error. For information about the supported compute capabilities, see GPU Computing Requirements (Parallel Computing Toolbox).'cpu'— Use the CPU.
Performance optimization, specified as the comma-separated pair consisting of'Acceleration' and one of the following:
'auto'— Automatically apply a number of optimizations suitable for the input network and hardware resource.'mex'— Compile and execute a MEX function. This option is available when using a GPU only. Using a GPU requires Parallel Computing Toolbox and a CUDA enabled NVIDIA GPU. If Parallel Computing Toolbox or a suitable GPU is not available, then the function returns an error. For information about the supported compute capabilities, see GPU Computing Requirements (Parallel Computing Toolbox).'none'— Disable all acceleration.
The default option is 'auto'. If 'auto' is specified, MATLAB® applies a number of compatible optimizations. If you use the'auto' option, MATLAB does not ever generate a MEX function.
Using the 'Acceleration' options 'auto' and'mex' can offer performance benefits, but at the expense of an increased initial run time. Subsequent calls with compatible parameters are faster. Use performance optimization when you plan to call the function multiple times using new input data.
The 'mex' option generates and executes a MEX function based on the network and parameters used in the function call. You can have several MEX functions associated with a single network at one time. Clearing the network variable also clears any MEX functions associated with that network.
The 'mex' option is only available for input data specified as a numeric array, cell array of numeric arrays, table, or image datastore. No other types of datastore support the 'mex' option.
The 'mex' option is only available when you are using a GPU. You must also have a C/C++ compiler installed. For setup instructions, see Set Up Compiler (GPU Coder).
'mex' acceleration does not support all layers. For a list of supported layers, see Supported Layers (GPU Coder).
Option to preprocess the test images before performing object detection, specified as the comma-separated pair consisting of 'DetectionPreprocessing' and one of these values:
'auto'— To preprocess the test image before performing object detection. Thedetectfunction calls thepreprocessfunction that perform these operations:- Rescales the intensity values of the training images to the range [0, 1].
- Resizes the training images to one of the nearest network input sizes and updates the bounding box coordinate values for accurate training. The function preserves the original aspect ratio of the training data.
'none'— To perform object detection without preprocessing the test image. If you choose this option, the datatype of the test image must be eithersingleordouble.
Data Types: char | string
Output Arguments
Location of objects detected within the input image or images, returned as a
- _M_-by-4 matrix or an _M_-by-5 matrix if the input is a single test image.
- _T_-by-1 cell array if the input is an array of test images.T is the number of test images in the array.M is the number of bounding boxes in an image
The table describes the format of bounding boxes.
| Bounding Box | Description |
|---|---|
| rectangle | Defined in spatial coordinates as an _M_-by-4 numeric matrix with rows of the form [x y w _h_], where: M is the number of axis-aligned rectangles.x and y specify the upper-left corner of the rectangle.w specifies the width of the rectangle, which is its length along the _x_-axis.h specifies the height of the rectangle, which is its length along the _y_-axis. |
| rotated-rectangle | Defined in spatial coordinates as an _M_-by-5 numeric matrix with rows of the form [xctr yctr xlen ylen _yaw_], where: M is the number of rotated rectangles.xctr and yctr specify the center of the rectangle.xlen specifies the width of the rectangle, which is its length along the _x_-axis before rotation.ylen specifies the height of the rectangle, which is its length along the _y_-axis before rotation.yaw specifies the rotation angle in degrees. The rotation is clockwise-positive around the center of the bounding box.  |
Detection confidence scores for each bounding box, returned as one of these options:
- _M_-by-1 numeric vector — The input is a single test image.M is the number of bounding boxes detected in the image.
- _B_-by-1 cell array — The input is a batch of test images, where B is the number of test images in the batch. Each cell in the array contains an _M_-element row vector, where each element indicates the detection score for a bounding box in the corresponding image.
A higher score indicates higher confidence in the detection. The confidence score for each detection is a product of the corresponding objectness score and maximum class probability. The objectness score is the probability that the object in the bounding box belongs to a class in the image. The maximum class probability is the largest probability that a detected object in the bounding box belongs to a particular class.
Labels for bounding boxes, returned as one of these options:
- _M_-by-1 categorical vector if the input is a single test image.
- _T_-by-1 cell array if the input is an array of test images.T is the number of test images in the array. Each cell in the array contains a _M_-by-1 categorical vector containing the names of the object classes.
M is the number of bounding boxes detected in an image.
Detection results, returned as a 3-column table with variable names,Boxes, Scores, and Labels. The Boxes column can contain rectangles or rotated rectangle bounding boxes of the form :
- rectangle — _M_-by-4 matrices, of M bounding boxes for the objects found in the image. Each row specifies a rectangle as a 4-element vector of the form [x,y,width,_height_], where (x,y) specifies the upper-left corner location and (width, height) specifies the size in pixels
- rotated rectangle — _M_-by-5 matrices of M bounding boxes for the objects found in the image. Each row specifies a rotated rectangle as a 5-element vector of the form [xctr,yctr,width,height,yaw_], where (xctr,yctr) specifies the center, (width,height) specifies the size, and_yaw specifies the rotated angle.
Class probabilities and objectness scores of the detections, returned as a structure array with these fields.
ClassProbabilities— Class probabilities for each of the detections, returned as a _B_-by-1 cell array. B is the number of images in the input batch of images,I. Each cell in the array contains the class probabilities as an_M_-by-N numeric matrix. M is the number of bounding boxes and N is the number of classes. Each class probability is a numeric scalar, indicating the probability that the detected object in the bounding box belongs to a class in the image.ObjectnessScores— Objectness scores for each of the detections, returned as a _B_-by-1 cell array. B is the number of images in the input batch of images,I. Each cell in the array contains the objectness score for each bounding box as an_M_-by-1 numeric vector. M is the number of bounding boxes. Each objectness score is a numeric scalar, indicating the probability that the bounding box contains an object belonging to one of the classes in the image.
Extended Capabilities
Usage notes and limitations:
- The
roiargument to thedetectmethod must be a code generation constant (coder.const()) and a 1x4 vector. - Only the
Threshold,SelectStrongest,MinSize, andMaxSizename-value pairs fordetectare supported.
Usage notes and limitations:
- The
roiargument to thedetectmethod must be a codegen constant (coder.const()) and a 1x4 vector. - Only the
Threshold,SelectStrongest,MinSize, andMaxSizename-value pairs are supported. - The height, width, and channel of the input image must be fixed size.
Usage notes and limitations:
- GPU Arrays is not supported for rotated rectangle bounding box.
Version History
Introduced in R2021a
Starting in R2024b, bboxes output argument returned as rotated rectangle bounding box predictions, supports both CPU and GPU code generation.
The output argument bboxes now support rotated rectangle bounding box predictions.
Specify the info output argument to return information about the class probability and objectness score for each detection.