arviz.plot_lm — ArviZ dev documentation (original) (raw)
arviz.plot_lm(y, idata=None, x=None, y_model=None, y_hat=None, num_samples=50, kind_pp='samples', kind_model='lines', xjitter=False, plot_dim=None, backend=None, y_kwargs=None, y_hat_plot_kwargs=None, y_hat_fill_kwargs=None, y_model_plot_kwargs=None, y_model_fill_kwargs=None, y_model_mean_kwargs=None, backend_kwargs=None, show=None, figsize=None, textsize=None, axes=None, legend=True, grid=True)[source]#
Posterior predictive and mean plots for regression-like data.
Parameters:
If str, variable name from observed_data.
idataInferenceData, Optional
Optional only if y is not str.
xstr, tuple of strings, DataArray or array_like, optional
If str or tuple, variable name from constant_data. If ndarray, could be 1D, or 2D for multiple plots. If None, coords name of y (y should be DataArray).
y_modelstr or Sequence, Optional
If str, variable name from posterior. Its dimensions should be same as y plus added chains and draws.
y_hatstr, Optional
If str, variable name from posterior_predictive. Its dimensions should be same as y plus added chains and draws.
num_samplesint, Optional, Default 50
Significant if kind_pp is “samples” or kind_model is “lines”. Number of samples to be drawn from posterior predictive or
kind_pp{“samples”, “hdi”}, Default “samples”
Options to visualize uncertainty in data.
kind_model{“lines”, “hdi”}, Default “lines”
Options to visualize uncertainty in mean of the data.
plot_dimstr, Optional
Necessary if y is multidimensional.
backendstr, Optional
Select plotting backend {“matplotlib”,”bokeh”}. Default “matplotlib”.
y_kwargsdict, optional
Passed to matplotlib.axes.Axes.plot() in matplotlib and bokeh:bokeh.plotting.Figure.circle() in bokeh
y_hat_plot_kwargsdict, optional
Passed to matplotlib.axes.Axes.plot() in matplotlib and bokeh:bokeh.plotting.Figure.circle() in bokeh
y_hat_fill_kwargsdict, optional
Passed to arviz.plot_hdi()
y_model_plot_kwargsdict, optional
Passed to matplotlib.axes.Axes.plot() in matplotlib and bokeh:bokeh.plotting.Figure.line() in bokeh
y_model_fill_kwargsdict, optional
Significant if kind_model is “hdi”. Passed to arviz.plot_hdi()
y_model_mean_kwargsdict, optional
Passed to matplotlib.axes.Axes.plot() in matplotlib and bokeh:bokeh.plotting.Figure.line() in bokeh
backend_kwargsdict, optional
These are kwargs specific to the backend being used. Passed tomatplotlib.pyplot.subplots() orbokeh.plotting.figure().
figsize(float, float), optional
Figure size. If None it will be defined automatically.
textsizefloat, optional
Text size scaling factor for labels, titles and lines. If None it will be autoscaled based on figsize.
axes2D numpy array_like of matplotlib Axes or bokeh_figures, optional
A 2D array of locations into which to plot the densities. If not supplied, Arviz will create its own array of plot areas (and return it).
showbool, optional
Call backend show function.
legendbool, optional
Add legend to figure. By default True.
gridbool, optional
Add grid to figure. By default True.
Returns:
axes: matplotlib axes or bokeh figures
See also
Plot timeseries data
Plot for posterior/prior predictive checks
Examples
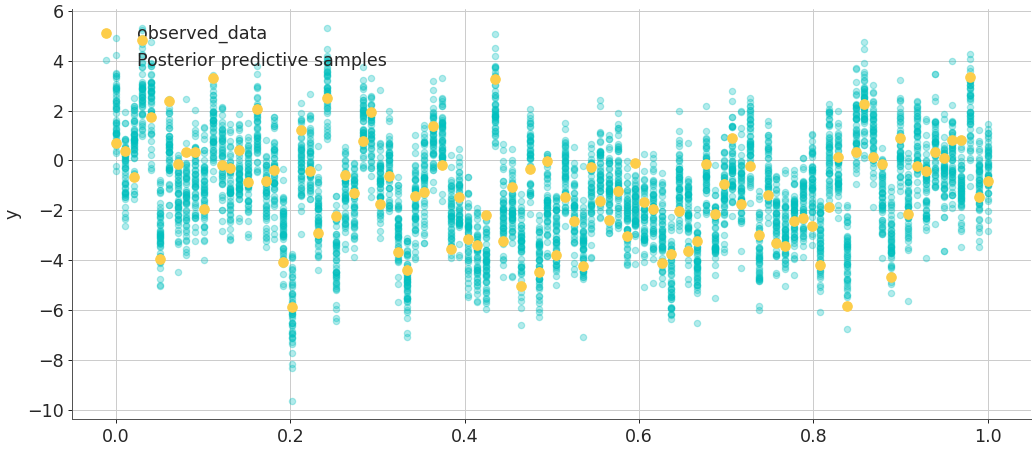
Plot regression default plot
import arviz as az import numpy as np import xarray as xr idata = az.load_arviz_data('regression1d') x = xr.DataArray(np.linspace(0, 1, 100)) idata.posterior["y_model"] = idata.posterior["intercept"] + idata.posterior["slope"]*x az.plot_lm(idata=idata, y="y", x=x)
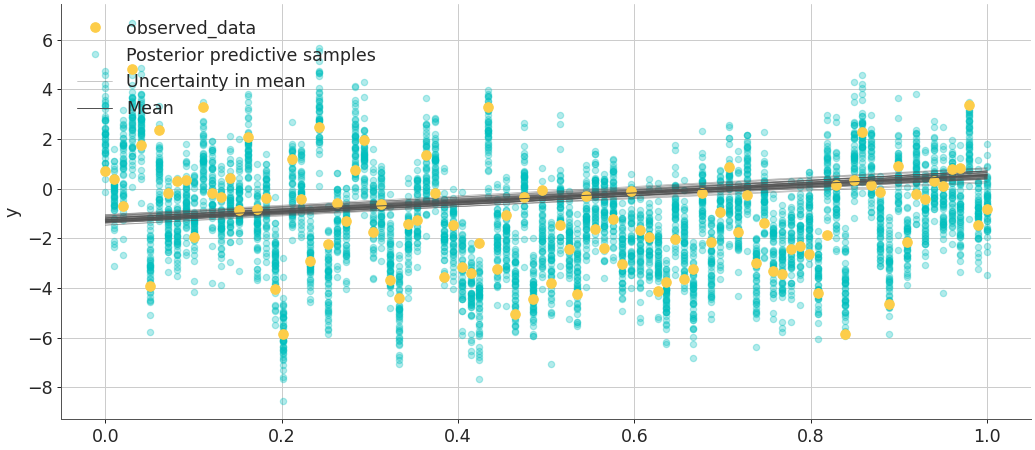
Plot regression data and mean uncertainty
az.plot_lm(idata=idata, y="y", x=x, y_model="y_model")
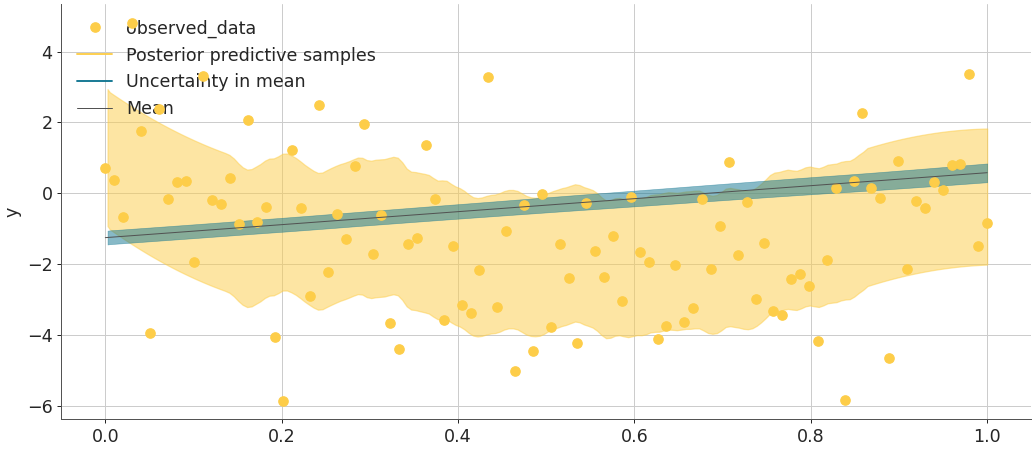
Plot regression data and mean uncertainty in hdi form
az.plot_lm( ... idata=idata, y="y", x=x, y_model="y_model", kind_pp="hdi", kind_model="hdi" ... )
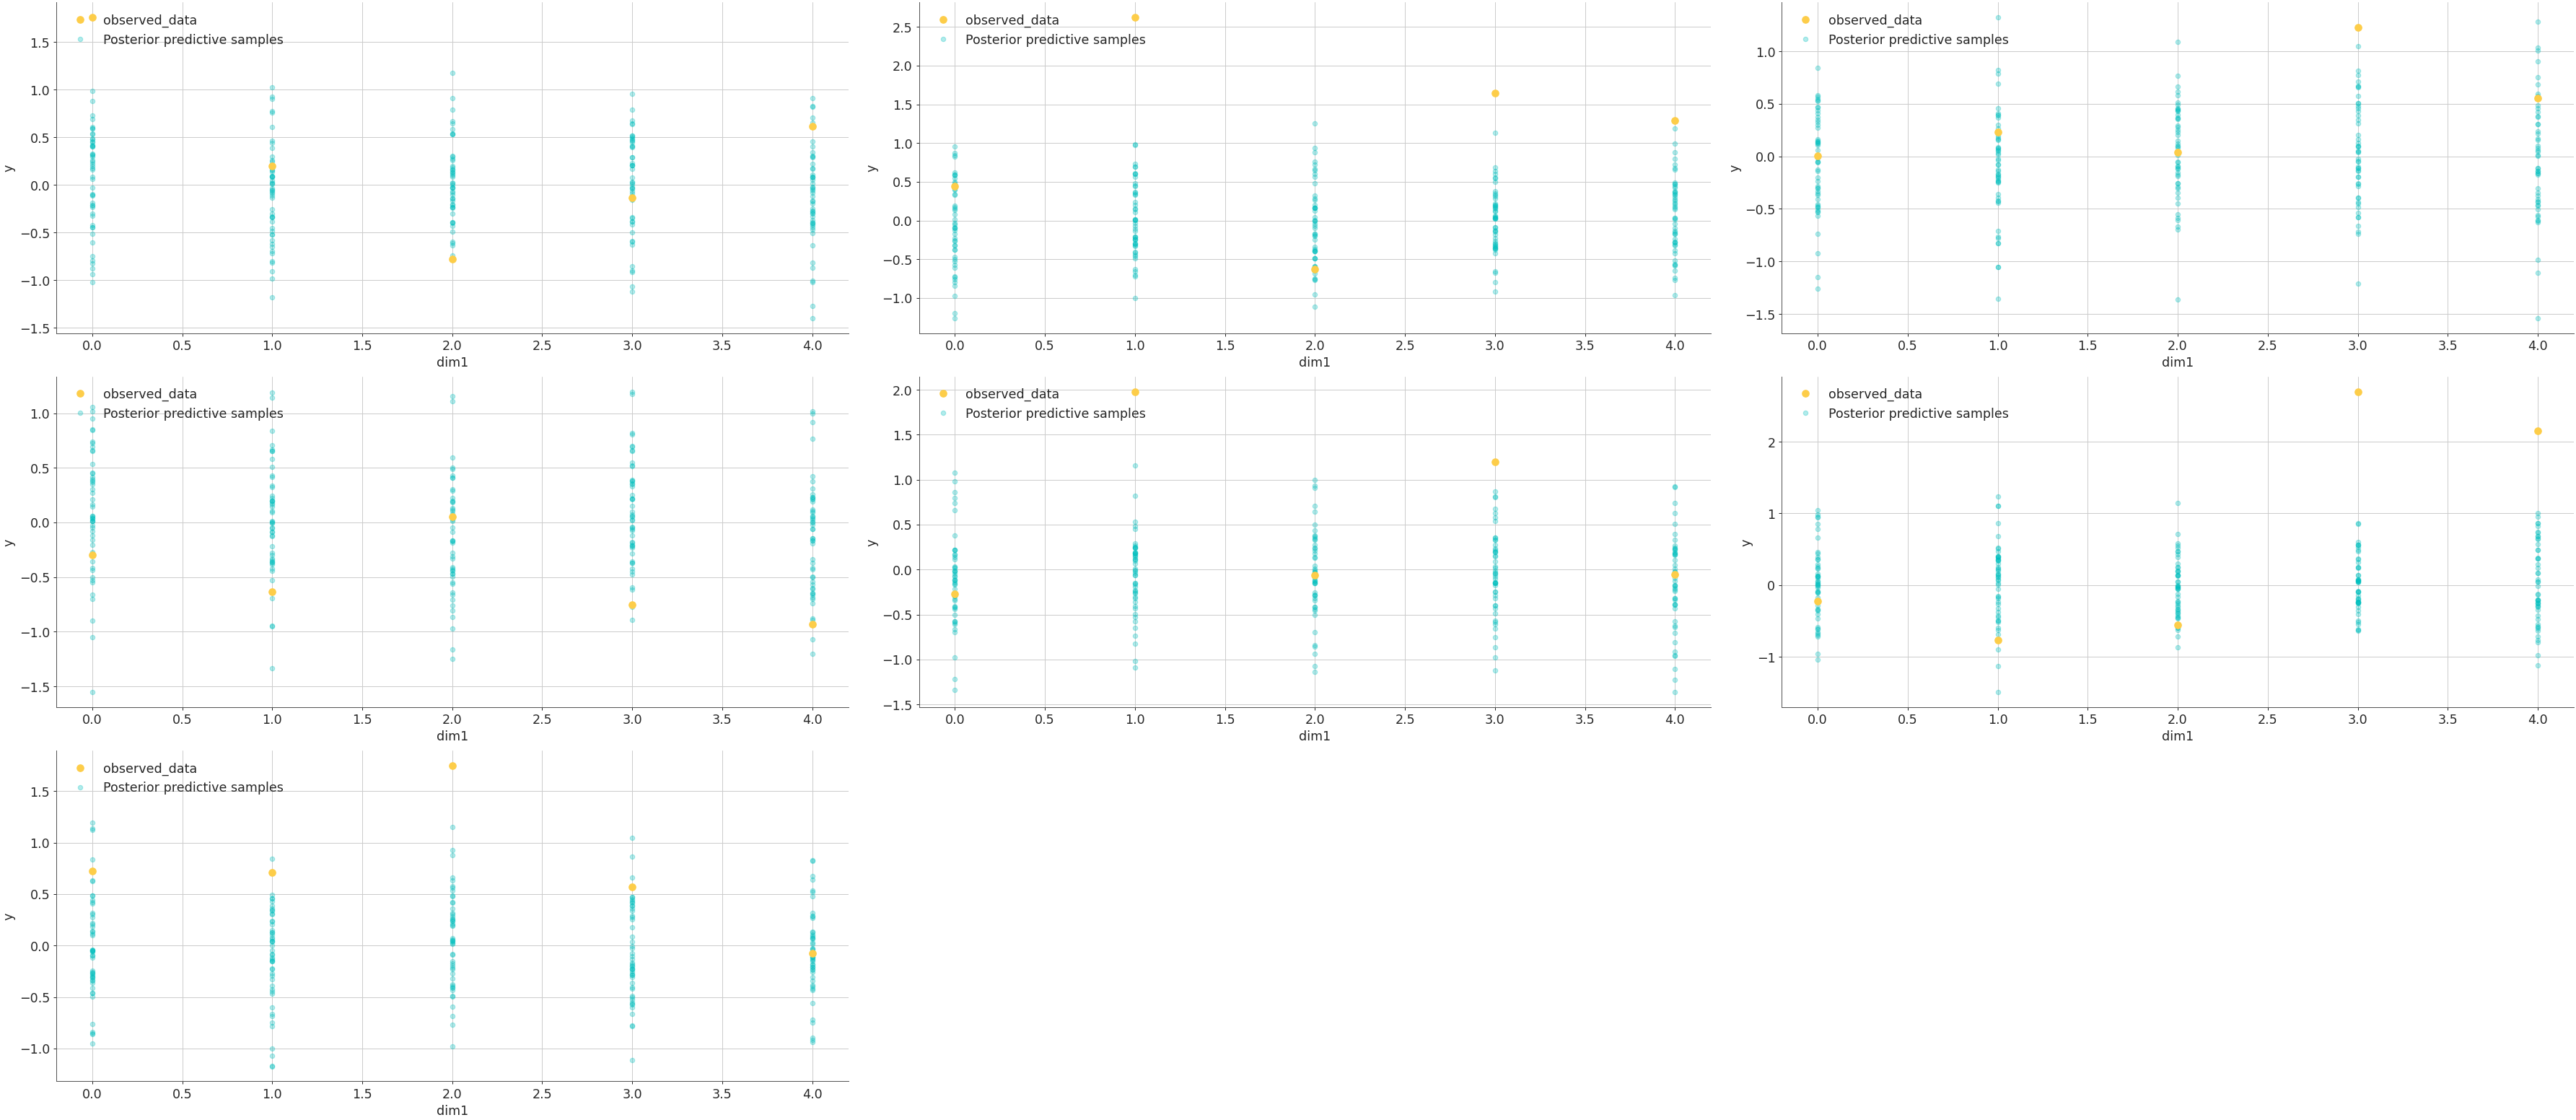
Plot regression data for multi-dimensional y using plot_dim
data = az.from_dict( ... observed_data = { "y": np.random.normal(size=(5, 7)) }, ... posterior_predictive = {"y": np.random.randn(4, 1000, 5, 7) / 2}, ... dims={"y": ["dim1", "dim2"]}, ... coords={"dim1": range(5), "dim2": range(7)} ... ) az.plot_lm(idata=data, y="y", plot_dim="dim1")