arviz.plot_mcse — ArviZ dev documentation (original) (raw)
arviz.plot_mcse(idata, var_names=None, filter_vars=None, coords=None, errorbar=False, grid=None, figsize=None, textsize=None, extra_methods=False, rug=False, rug_kind='diverging', n_points=20, labeller=None, ax=None, rug_kwargs=None, extra_kwargs=None, text_kwargs=None, backend=None, backend_kwargs=None, show=None, **kwargs)[source]#
Plot quantile or local Monte Carlo Standard Error.
Parameters:
idataobj
Any object that can be converted to an arviz.InferenceData object Refer to documentation of arviz.convert_to_dataset() for details
var_nameslist of variable names, optional
Variables to be plotted. Prefix the variables by ~ when you want to exclude them from the plot.
filter_vars{None, “like”, “regex”}, optional, default=None
If None (default), interpret var_names as the real variables names. If “like”, interpret var_names as substrings of the real variables names. If “regex”, interpret var_names as regular expressions on the real variables names. A lapandas.filter.
coordsdict, optional
Coordinates of var_names to be plotted. Passed to xarray.Dataset.sel()
errorbarbool, optional
Plot quantile value +/- mcse instead of plotting mcse.
gridtuple
Number of rows and columns. Defaults to None, the rows and columns are automatically inferred.
figsize(float, float), optional
Figure size. If None it will be defined automatically.
textsizefloat, optional
Text size scaling factor for labels, titles and lines. If None it will be autoscaled based on figsize.
extra_methodsbool, optional
Plot mean and sd MCSE as horizontal lines. Only taken into account whenerrorbar=False.
rugbool
Plot rug plot of values diverging or that reached the max tree depth.
rug_kindbool
Variable in sample stats to use as rug mask. Must be a boolean variable.
n_pointsint
Number of points for which to plot their quantile/local ess or number of subsets in the evolution plot.
labellerLabeller, optional
Class providing the method make_label_vert to generate the labels in the plot titles. Read the Label guide for more details and usage examples.
ax2D array_like of matplotlib Axes or bokeh_figures, optional
A 2D array of locations into which to plot the densities. If not supplied, Arviz will create its own array of plot areas (and return it).
rug_kwargsdict
kwargs passed to rug plot inmatplotlib.axes.Axes.plot() or bokeh.models.glyphs.Scatter.
extra_kwargsdict, optional
kwargs passed as extra method lines inmatplotlib.axes.Axes.axhline() or bokeh.models.Span
text_kwargsdict, optional
kwargs passed to matplotlib.axes.Axes.annotate() for extra methods lines labels. It accepts the additional key x to set xy=(text_kwargs["x"], mcse). text_kwargs are ignored for the bokeh plotting backend.
backendstr, optional
Select plotting backend {“matplotlib”,”bokeh”}. Default “matplotlib”.
backend_kwargsbool, optional
These are kwargs specific to the backend being passed tomatplotlib.pyplot.subplots() or bokeh.plotting.figure().
show: bool, optional
Call backend show function.
**kwargs
Passed as-is to matplotlib.axes.Axes.hist() ormatplotlib.axes.Axes.plot() in matplotlib depending on the value of kind.
Returns:
axesmatplotlib axes or bokeh figures
See also
Calculate Markov Chain Standard Error statistic.
References
[1]
Vehtari et al. (2021). Rank-normalization, folding, and localization: An improved Rhat for assessing convergence of MCMC. Bayesian analysis, 16(2):667-718.
Examples
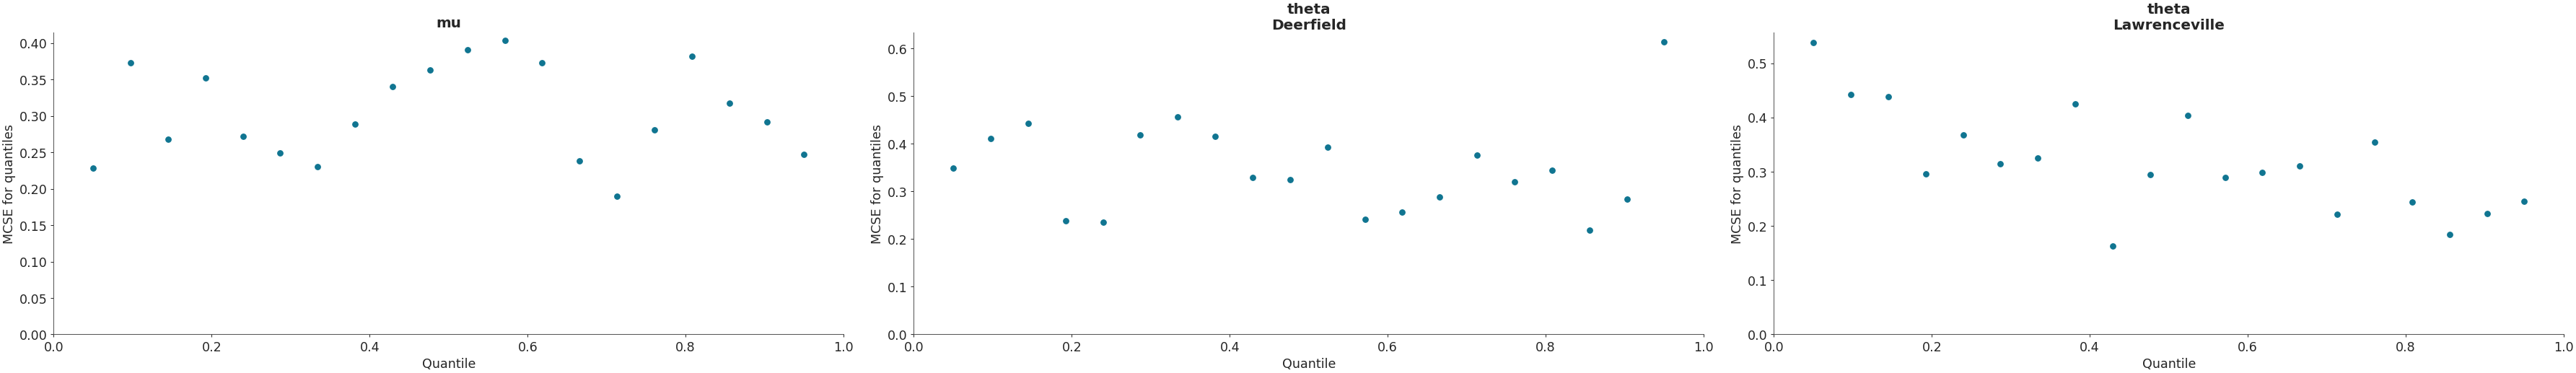
Plot quantile Monte Carlo Standard Error.
import arviz as az idata = az.load_arviz_data("centered_eight") coords = {"school": ["Deerfield", "Lawrenceville"]} az.plot_mcse( ... idata, var_names=["mu", "theta"], coords=coords ... )