PrecisionRecallDisplay (original) (raw)
class sklearn.metrics.PrecisionRecallDisplay(precision, recall, *, average_precision=None, name=None, pos_label=None, prevalence_pos_label=None, estimator_name='deprecated')[source]#
Precision Recall visualization.
It is recommended to usefrom_estimator orfrom_predictions to create a PrecisionRecallDisplay. All parameters are stored as attributes.
For general information regarding scikit-learn visualization tools, see the Visualization Guide. For guidance on interpreting these plots, refer to the Model Evaluation Guide.
Parameters:
precisionndarray
Precision values.
recallndarray
Recall values.
average_precisionfloat, default=None
Average precision. If None, the average precision is not shown.
namestr, default=None
Name of estimator. If None, then the estimator name is not shown.
Changed in version 1.8: estimator_name was deprecated in favor of name.
pos_labelint, float, bool or str, default=None
The class considered the positive class when precision and recall metrics computed. If not None, this value is displayed in the x- and y-axes labels.
Added in version 0.24.
prevalence_pos_labelfloat, default=None
The prevalence of the positive label. It is used for plotting the chance level line. If None, the chance level line will not be plotted even if plot_chance_level is set to True when plotting.
Added in version 1.3.
estimator_namestr, default=None
Name of estimator. If None, the estimator name is not shown.
Deprecated since version 1.8: estimator_name is deprecated and will be removed in 1.10. Use nameinstead.
Attributes:
**line_**matplotlib Artist
Precision recall curve.
**chance_level_**matplotlib Artist or None
The chance level line. It is None if the chance level is not plotted.
Added in version 1.3.
**ax_**matplotlib Axes
Axes with precision recall curve.
**figure_**matplotlib Figure
Figure containing the curve.
See also
Compute precision-recall pairs for different probability thresholds.
PrecisionRecallDisplay.from_estimator
Plot Precision Recall Curve given a binary classifier.
PrecisionRecallDisplay.from_predictions
Plot Precision Recall Curve using predictions from a binary classifier.
Notes
The average precision (cf. average_precision_score) in scikit-learn is computed without any interpolation. To be consistent with this metric, the precision-recall curve is plotted without any interpolation as well (step-wise style).
You can change this style by passing the keyword argumentdrawstyle="default" in plot, from_estimator, orfrom_predictions. However, the curve will not be strictly consistent with the reported average precision.
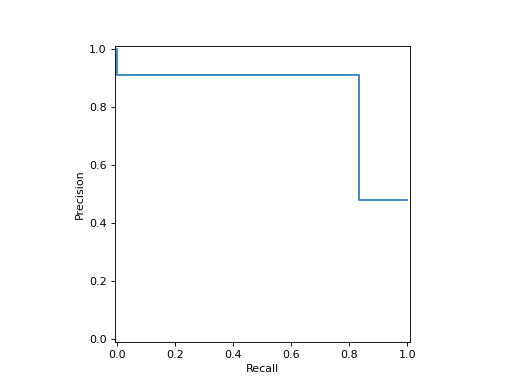
Examples
import matplotlib.pyplot as plt from sklearn.datasets import make_classification from sklearn.metrics import (precision_recall_curve, ... PrecisionRecallDisplay) from sklearn.model_selection import train_test_split from sklearn.svm import SVC X, y = make_classification(random_state=0) X_train, X_test, y_train, y_test = train_test_split(X, y, ... random_state=0) clf = SVC(random_state=0) clf.fit(X_train, y_train) SVC(random_state=0) predictions = clf.predict(X_test) precision, recall, _ = precision_recall_curve(y_test, predictions) disp = PrecisionRecallDisplay(precision=precision, recall=recall) disp.plot() <...> plt.show()
classmethod from_estimator(estimator, X, y, *, sample_weight=None, drop_intermediate=False, response_method='auto', pos_label=None, name=None, ax=None, plot_chance_level=False, chance_level_kw=None, despine=False, **kwargs)[source]#
Plot precision-recall curve given an estimator and some data.
For general information regarding scikit-learn visualization tools, see the Visualization Guide. For guidance on interpreting these plots, refer to the Model Evaluation Guide.
Parameters:
estimatorestimator instance
Fitted classifier or a fitted Pipelinein which the last estimator is a classifier.
X{array-like, sparse matrix} of shape (n_samples, n_features)
Input values.
yarray-like of shape (n_samples,)
Target values.
sample_weightarray-like of shape (n_samples,), default=None
Sample weights.
drop_intermediatebool, default=False
Whether to drop some suboptimal thresholds which would not appear on a plotted precision-recall curve. This is useful in order to create lighter precision-recall curves.
Added in version 1.3.
response_method{‘predict_proba’, ‘decision_function’, ‘auto’}, default=’auto’
Specifies whether to use predict_proba ordecision_function as the target response. If set to ‘auto’,predict_proba is tried first and if it does not existdecision_function is tried next.
pos_labelint, float, bool or str, default=None
The class considered as the positive class when computing the precision and recall metrics. By default, estimators.classes_[1]is considered as the positive class.
namestr, default=None
Name for labeling curve. If None, no name is used.
axmatplotlib axes, default=None
Axes object to plot on. If None, a new figure and axes is created.
plot_chance_levelbool, default=False
Whether to plot the chance level. The chance level is the prevalence of the positive label computed from the data passed duringfrom_estimator or from_predictions call.
Added in version 1.3.
chance_level_kwdict, default=None
Keyword arguments to be passed to matplotlib’s plot for rendering the chance level line.
Added in version 1.3.
despinebool, default=False
Whether to remove the top and right spines from the plot.
Added in version 1.6.
**kwargsdict
Keyword arguments to be passed to matplotlib’s plot.
Returns:
displayPrecisionRecallDisplay
See also
PrecisionRecallDisplay.from_predictions
Plot precision-recall curve using estimated probabilities or output of decision function.
Notes
The average precision (cf. average_precision_score) in scikit-learn is computed without any interpolation. To be consistent with this metric, the precision-recall curve is plotted without any interpolation as well (step-wise style).
You can change this style by passing the keyword argumentdrawstyle="default". However, the curve will not be strictly consistent with the reported average precision.
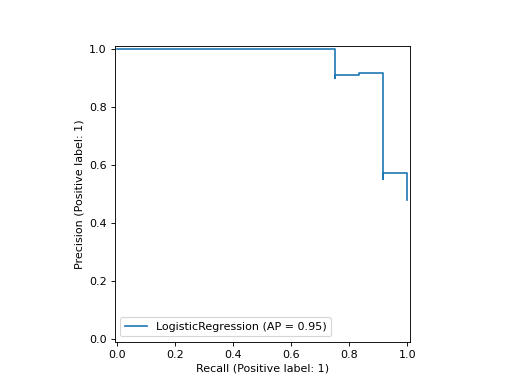
Examples
import matplotlib.pyplot as plt from sklearn.datasets import make_classification from sklearn.metrics import PrecisionRecallDisplay from sklearn.model_selection import train_test_split from sklearn.linear_model import LogisticRegression X, y = make_classification(random_state=0) X_train, X_test, y_train, y_test = train_test_split( ... X, y, random_state=0) clf = LogisticRegression() clf.fit(X_train, y_train) LogisticRegression() PrecisionRecallDisplay.from_estimator( ... clf, X_test, y_test) <...> plt.show()
classmethod from_predictions(y_true, y_score=None, *, sample_weight=None, drop_intermediate=False, pos_label=None, name=None, ax=None, plot_chance_level=False, chance_level_kw=None, despine=False, y_pred='deprecated', **kwargs)[source]#
Plot precision-recall curve given binary class predictions.
For general information regarding scikit-learn visualization tools, see the Visualization Guide. For guidance on interpreting these plots, refer to the Model Evaluation Guide.
Parameters:
y_truearray-like of shape (n_samples,)
True binary labels.
y_scorearray-like of shape (n_samples,)
Estimated probabilities or output of decision function.
Added in version 1.8: y_pred has been renamed to y_score.
sample_weightarray-like of shape (n_samples,), default=None
Sample weights.
drop_intermediatebool, default=False
Whether to drop some suboptimal thresholds which would not appear on a plotted precision-recall curve. This is useful in order to create lighter precision-recall curves.
Added in version 1.3.
pos_labelint, float, bool or str, default=None
The class considered as the positive class when computing the precision and recall metrics. When pos_label=None, if y_true is in {-1, 1} or {0, 1}, pos_label is set to 1, otherwise an error will be raised.
namestr, default=None
Name for labeling curve. If None, name will be set to"Classifier".
axmatplotlib axes, default=None
Axes object to plot on. If None, a new figure and axes is created.
plot_chance_levelbool, default=False
Whether to plot the chance level. The chance level is the prevalence of the positive label computed from the data passed duringfrom_estimator or from_predictions call.
Added in version 1.3.
chance_level_kwdict, default=None
Keyword arguments to be passed to matplotlib’s plot for rendering the chance level line.
Added in version 1.3.
despinebool, default=False
Whether to remove the top and right spines from the plot.
Added in version 1.6.
y_predarray-like of shape (n_samples,)
Estimated probabilities or output of decision function.
Deprecated since version 1.8: y_pred is deprecated and will be removed in 1.10. Usey_score instead.
**kwargsdict
Keyword arguments to be passed to matplotlib’s plot.
Returns:
displayPrecisionRecallDisplay
See also
PrecisionRecallDisplay.from_estimator
Plot precision-recall curve using an estimator.
Notes
The average precision (cf. average_precision_score) in scikit-learn is computed without any interpolation. To be consistent with this metric, the precision-recall curve is plotted without any interpolation as well (step-wise style).
You can change this style by passing the keyword argumentdrawstyle="default". However, the curve will not be strictly consistent with the reported average precision.
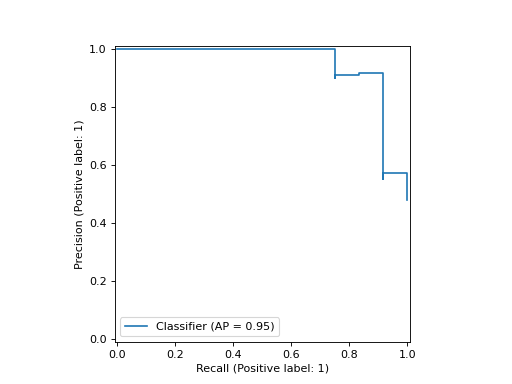
Examples
import matplotlib.pyplot as plt from sklearn.datasets import make_classification from sklearn.metrics import PrecisionRecallDisplay from sklearn.model_selection import train_test_split from sklearn.linear_model import LogisticRegression X, y = make_classification(random_state=0) X_train, X_test, y_train, y_test = train_test_split( ... X, y, random_state=0) clf = LogisticRegression() clf.fit(X_train, y_train) LogisticRegression() y_score = clf.predict_proba(X_test)[:, 1] PrecisionRecallDisplay.from_predictions( ... y_test, y_score) <...> plt.show()
plot(ax=None, *, name=None, plot_chance_level=False, chance_level_kw=None, despine=False, **kwargs)[source]#
Plot visualization.
Extra keyword arguments will be passed to matplotlib’s plot.
Parameters:
axMatplotlib Axes, default=None
Axes object to plot on. If None, a new figure and axes is created.
namestr, default=None
Name of precision recall curve for labeling. If None, usename if not None, otherwise no labeling is shown.
plot_chance_levelbool, default=False
Whether to plot the chance level. The chance level is the prevalence of the positive label computed from the data passed duringfrom_estimator or from_predictions call.
Added in version 1.3.
chance_level_kwdict, default=None
Keyword arguments to be passed to matplotlib’s plot for rendering the chance level line.
Added in version 1.3.
despinebool, default=False
Whether to remove the top and right spines from the plot.
Added in version 1.6.
**kwargsdict
Keyword arguments to be passed to matplotlib’s plot.
Returns:
displayPrecisionRecallDisplay
Object that stores computed values.
Notes
The average precision (cf. average_precision_score) in scikit-learn is computed without any interpolation. To be consistent with this metric, the precision-recall curve is plotted without any interpolation as well (step-wise style).
You can change this style by passing the keyword argumentdrawstyle="default". However, the curve will not be strictly consistent with the reported average precision.