Debug tool window | IntelliJ IDEA (original) (raw)
When you start a debugger session, the Debug tool window opens. Use this window to control the debugger session, view and analyze the program data (frames, threads, variables, and so on), and perform debugger actions.
By default, the Debug tool window opens when your program hits a breakpoint and is not hidden when the session is terminated. To change this behavior, go to the Build, Execution, Deployment | Debugger settings page Ctrl+Alt+S and clear the Show debug window on breakpoint checkbox.
If you prefer that the Debug tool window is hidden until a breakpoint is hit, clear the Open run/debug tool window when started checkbox in the corresponding run/debug configuration.
Sessions
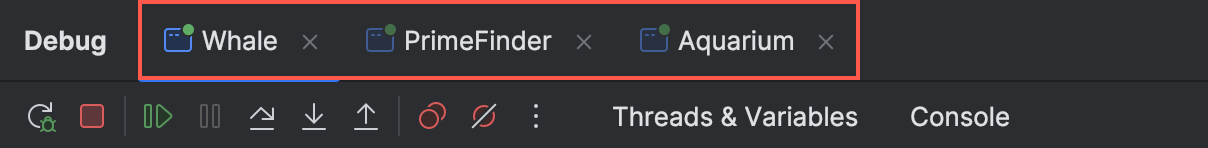
The available debug sessions are separated into tabs in the top part of the Debug tool window.
If you enable the Services tool window for specific run/debug configurations, the entire view of the Debug tool window will be displayed inside the Services tool window when you debug any of these configurations.
All the information in the editor, like inline variable values and execution point, is shown for the selected session tab. This is important if you are running several debug sessions in parallel that use the same classes.

When you close a tab, the corresponding debug session terminates.
Tabs
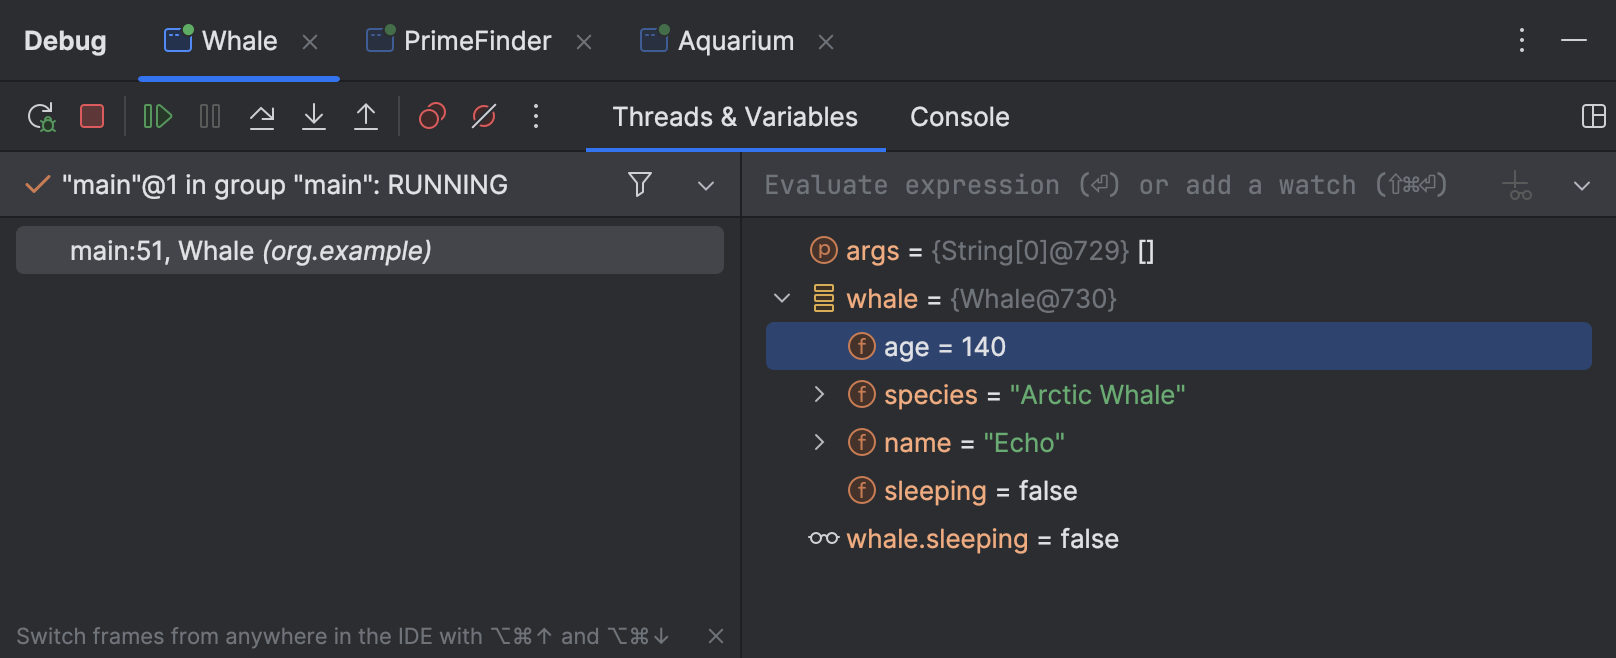
The Debug tool window shows the following tabs for each session:
- Frames: lets you navigate in the call stacks of the threads.
- Variables: lists the variables available in the current context and lets you analyze and modify the program state.
- Watches: lets you manage watches. By default, watches are shown on the Variables tab for more efficient use of the screen space. If you have a lot of watches, consider viewing them in a separate tab.
- Console: displays the program output.
For local sessions, the tab works the same as when you just run the program without the debugger attached. The only difference is that debugger output (for example, log messages from breakpoints) is added to the console.
When you attach to a process, the program output is not redirected and only the debugger output is shown in the debugger console. - Threads: displays the list of live threads, lets you switch between them, and export a thread dump.
- Memory: provides the information on the objects that are currently on the heap for monitoring their number and lifetime.
- Overhead: lets you monitor the resources consumed by particular debugger features and optimize the debugger performance.
Switch tabs
- To cycle through the tool window tabs, press Alt+Right and Alt+Left.
Show/hide tabs
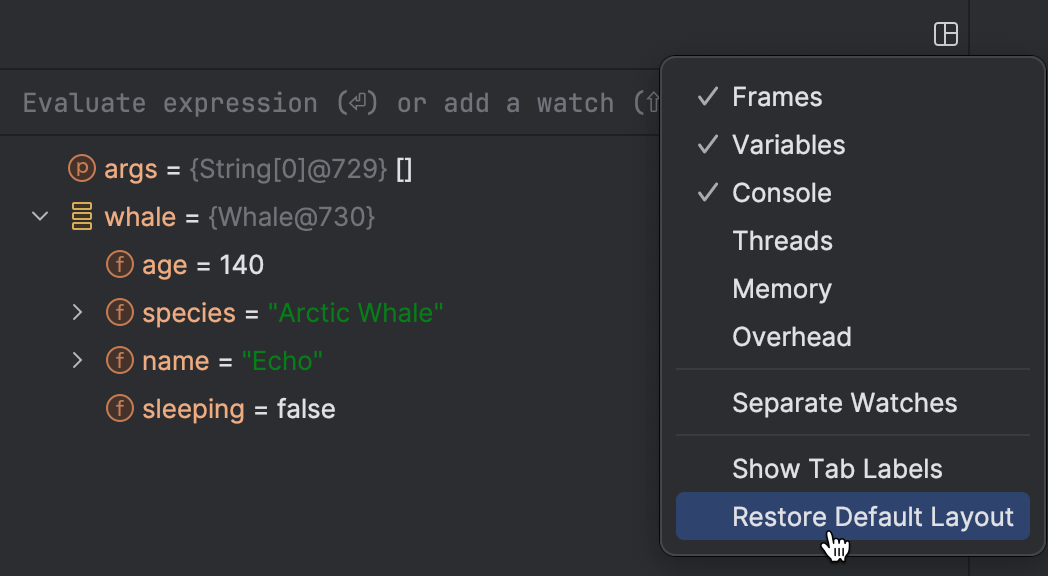
- Click
 and select which tabs you want to see.
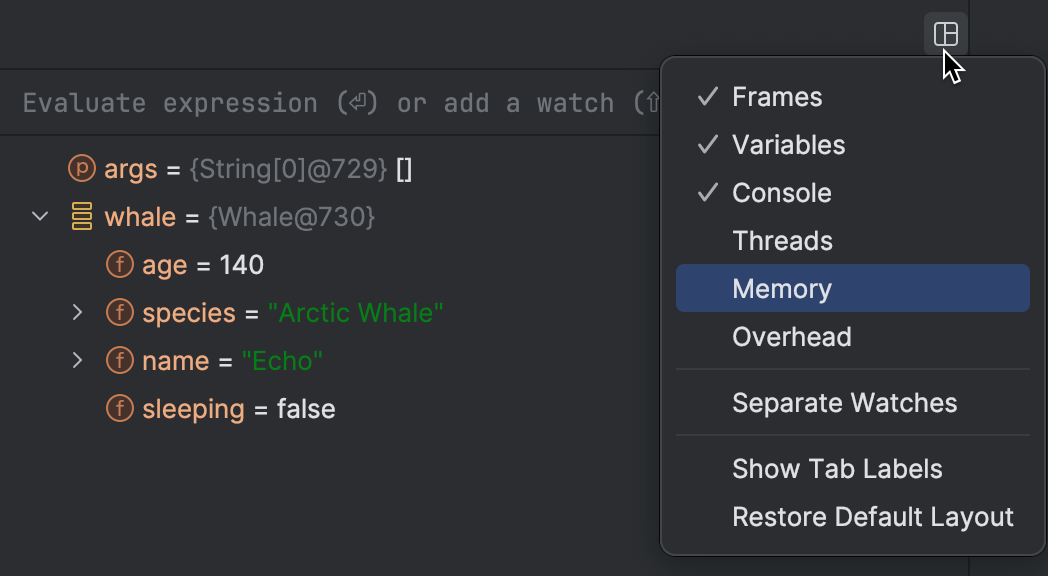
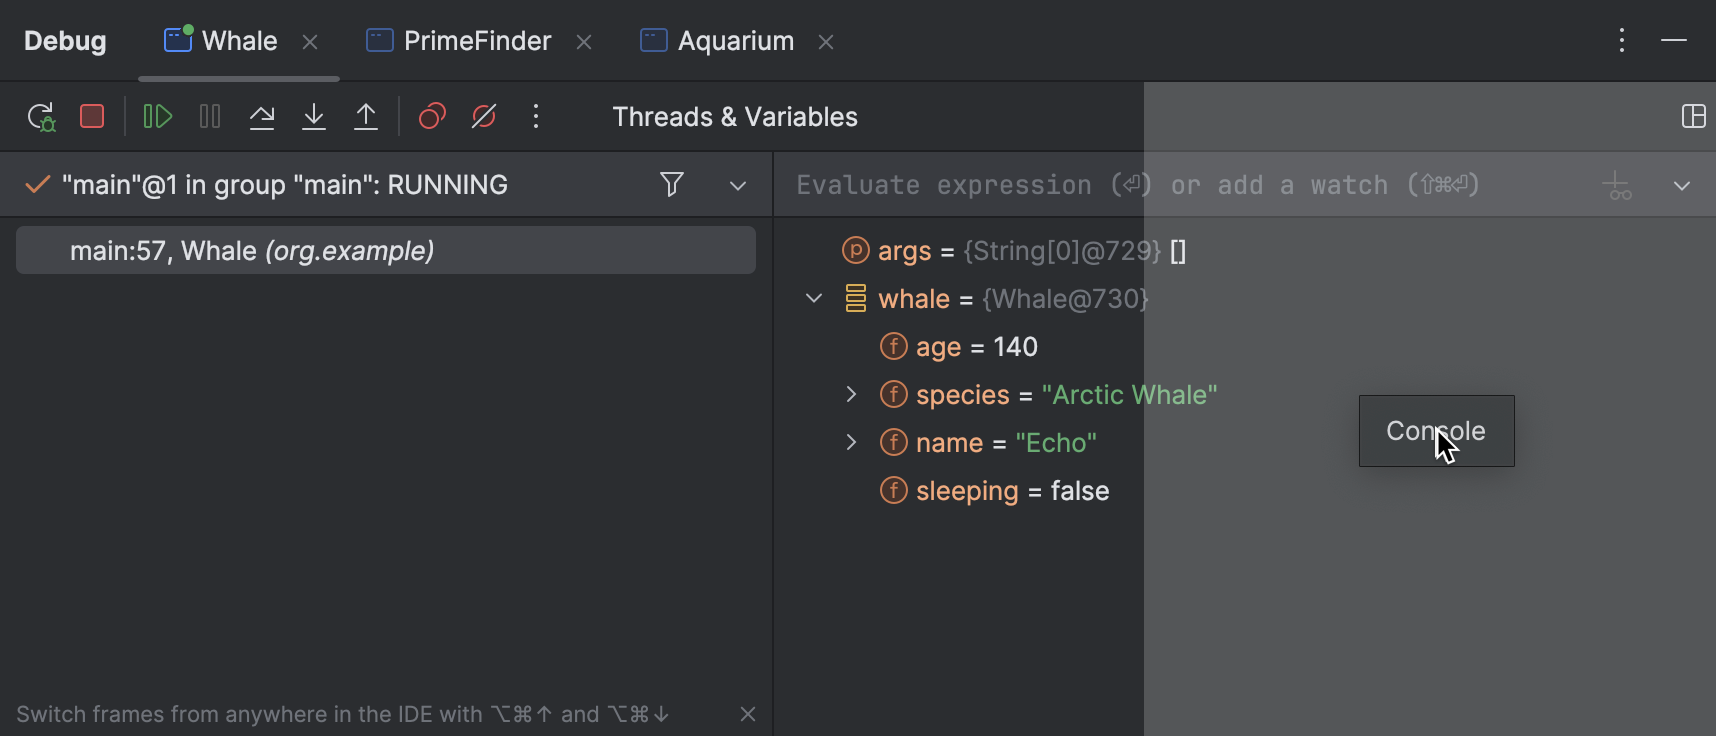
Move tabs
You can arrange the tabs to fit your preference. You can move a tab to another location or group a tab with another tab, so that they share the same space on the screen.
- Drag the tab header to the desired location. The blue frame indicates the destination.
Restore default layout
If you changed the layout of the Debug tool window and don't like the new arrangement, you can revert it to the default state.
- Click in the top-right corner of the Debug tool window, then click Restore Default Layout.
The debugger toolbar contains the most commonly used actions for controlling the debugger session and stepping.

You can configure the list of actions available on the toolbar according to your preferences.
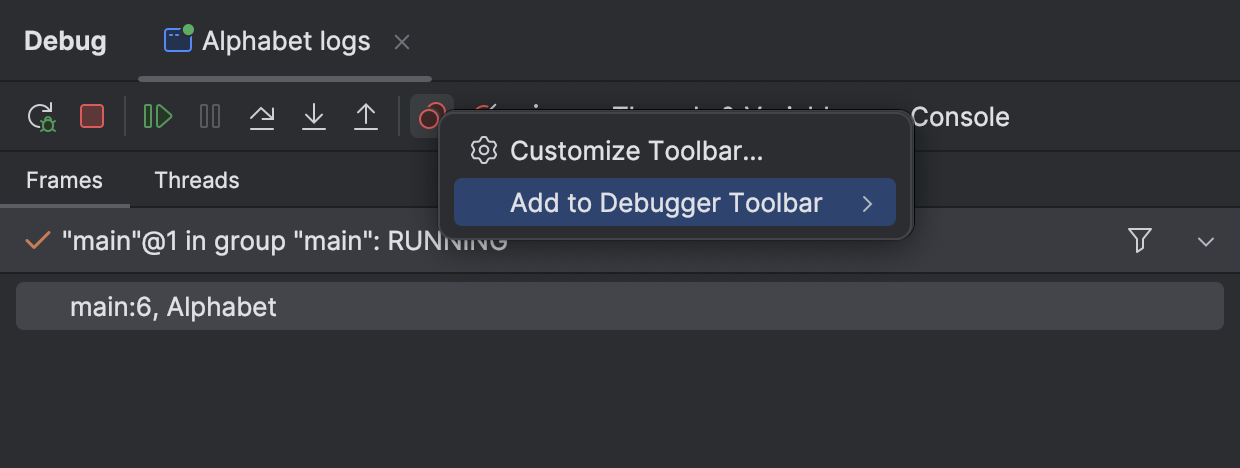
Customize the debugger's toolbar
- To add a debugging action, right-click the debugger toolbar, select Add to Debugger Toolbar from the context menu, and then select the required action from the list.
- To add an action that is not directly related to debugging, right-click the debugger toolbar, and then select Customize Toolbar from the context menu.
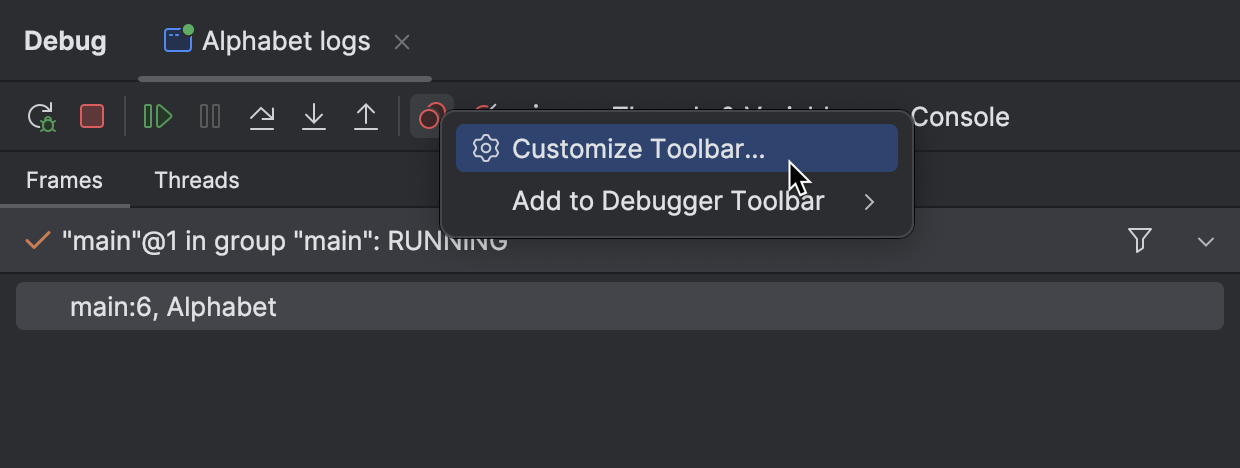
In the dialog that opens, click Add, and then select the required action.
Last modified: 03 April 2025