Debug tool window | WebStorm (original) (raw)
When you start a debugger session, the Debug tool window opens. Use this window to control the debugger session, view and analyze the program data (frames, threads, variables, and so on), and perform debugger actions.
By default, the Debug tool window opens when your program hits a breakpoint and is not hidden when the session is terminated. To change this behavior, go to the Build, Execution, Deployment | Debugger settings page Ctrl+Alt+S and clear the Show debug window on breakpoint checkbox.
Sessions
If you run several debug sessions simultaneously, they are separated into tabs in the top part of the Debug tool window.

All the information in the editor, like inline variable values and execution point, is shown for the selected session tab. This is important if you are running several debug sessions in parallel that use the same classes.
When you close a tab, the corresponding debug session terminates.
Tabs
The Debug tool window shows the following tabs for each session:
- Frames: use this pane to navigate in call stacks and switch between threads when debugging a multiprocess Node.js application or Service Workers.
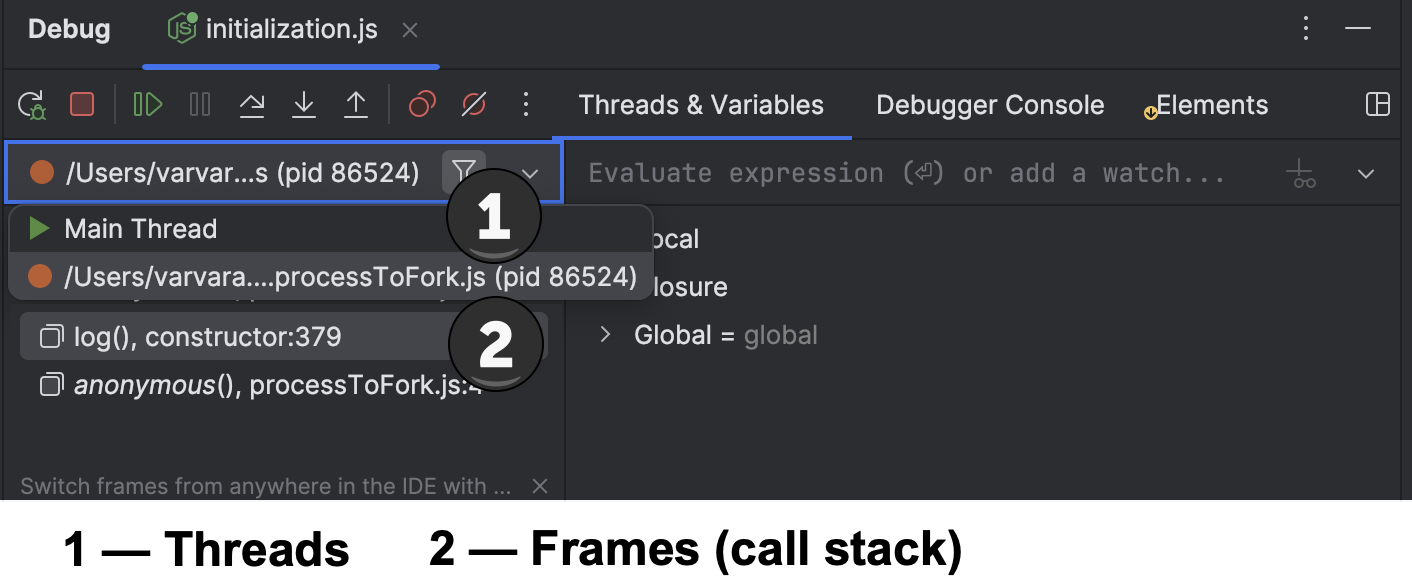
- Variables: lists the variables available in the current context and lets you analyze and modify the program state.
- Watches: lets you manage watches. By default, watches are shown on the Variables tab for more efficient use of the screen space. If you have a lot of watches, consider viewing them in a separate tab.
- Console: displays the program output.
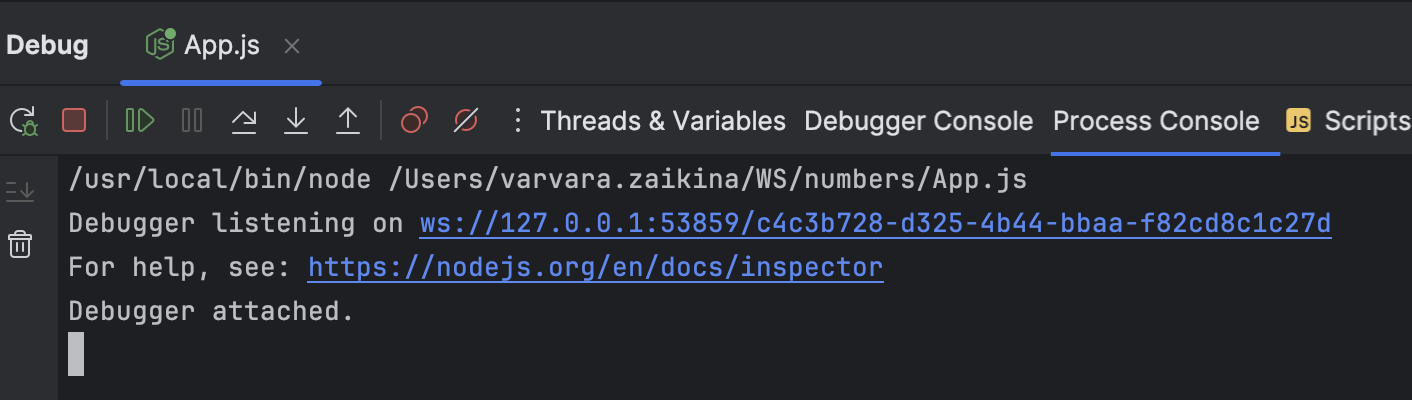
For client-side applications, the tab also shows everything that was logged in your code (for example, usingconsole.*) and behaves also as a read-eval-print loop (REPL) so you can run JavaScript code snippets in it and interact with the page that you are currently debugging. Learn more from Interactive debugger console - Process Console: WebStorm opens this tab when you are debugging a Node.js application. The tab shows the output of the node process itself, that is, everything that is written to process.stdout and process.stderr directly or is logged using console.*. Learn more from Using interactive Debugger Console.
- Debugger Console: WebStorm opens this tab when you are debugging a Node.js application. Here you can run JavaScript code snippets and view the console.* messages.
Learn more from Using interactive Debugger Console. - Scripts: during a JavaScript debugging session, the tab shows all the external resources that are automatically downloaded during the JavaScript code execution. Use this tab to monitor downloading the external resources. To open the code of a resource in the editor, double-click the item in question.
- Elements: this tab shows the actual HTML source code and the HTML DOM structure of the active browser page. Use the tab to monitor the changes made to the page through the browser.
The tab is available only when you are debugging client-side code.
Switch tabs
- To cycle through the tool window tabs, press Alt+Right and Alt+Left.
Show/hide tabs
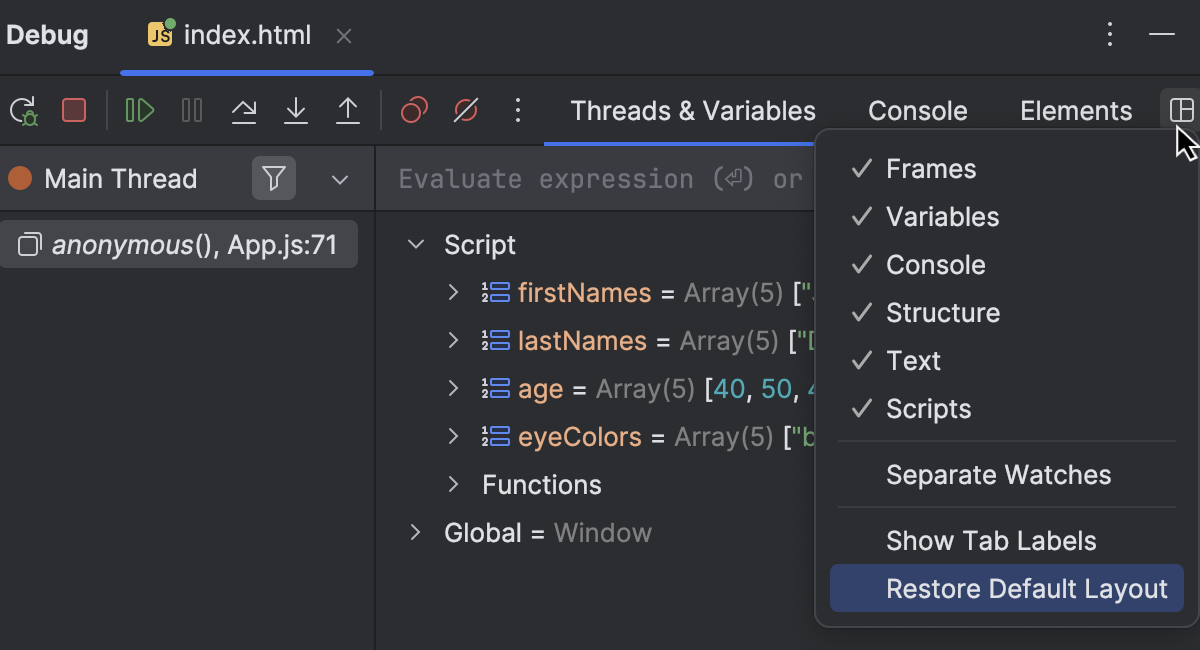
- Click
 and select which tabs you want to see.
Move tabs
You can arrange the tabs to fit your preference. You can move a tab to another location or group a tab with another tab, so that they share the same space on the screen.
- Drag the tab header to the desired location. The blue frame indicates the destination.
Restore default layout
If you changed the layout of the Debug tool window and don't like the new arrangement, you can revert it to the default state.
- Click in the top-right corner of the Debug tool window, then click Restore Default Layout.
The debugger toolbar contains the most commonly used actions for controlling the debugger session and stepping.
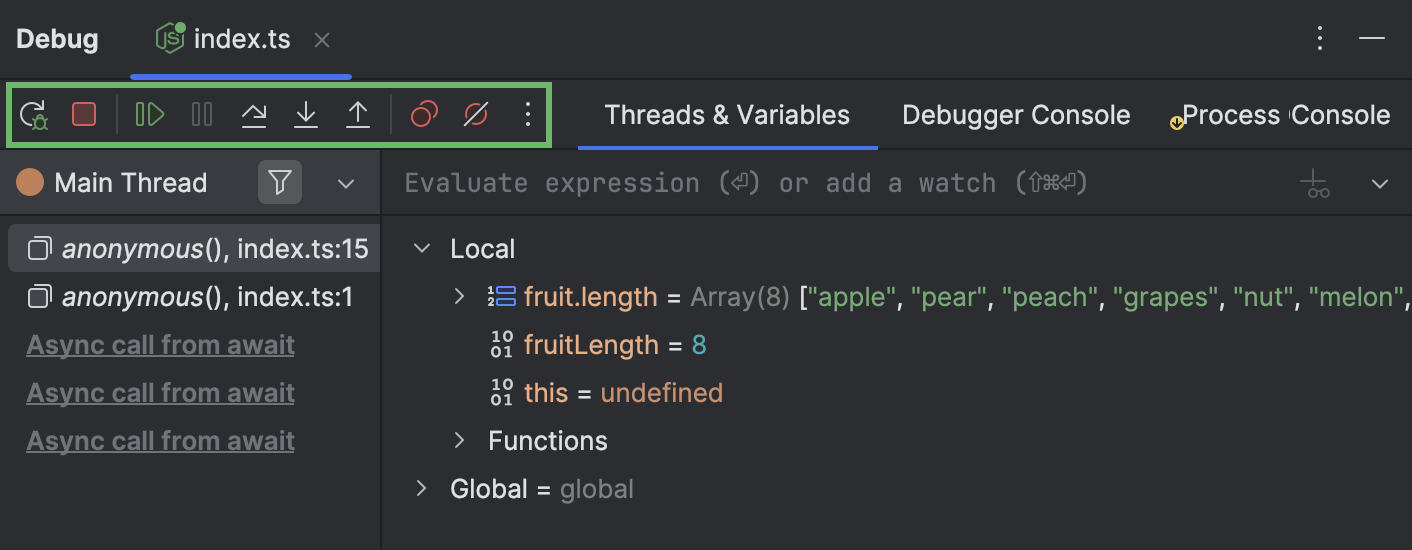
You can configure the list of actions available on the toolbar according to your preferences.
Customize the debugger's toolbar
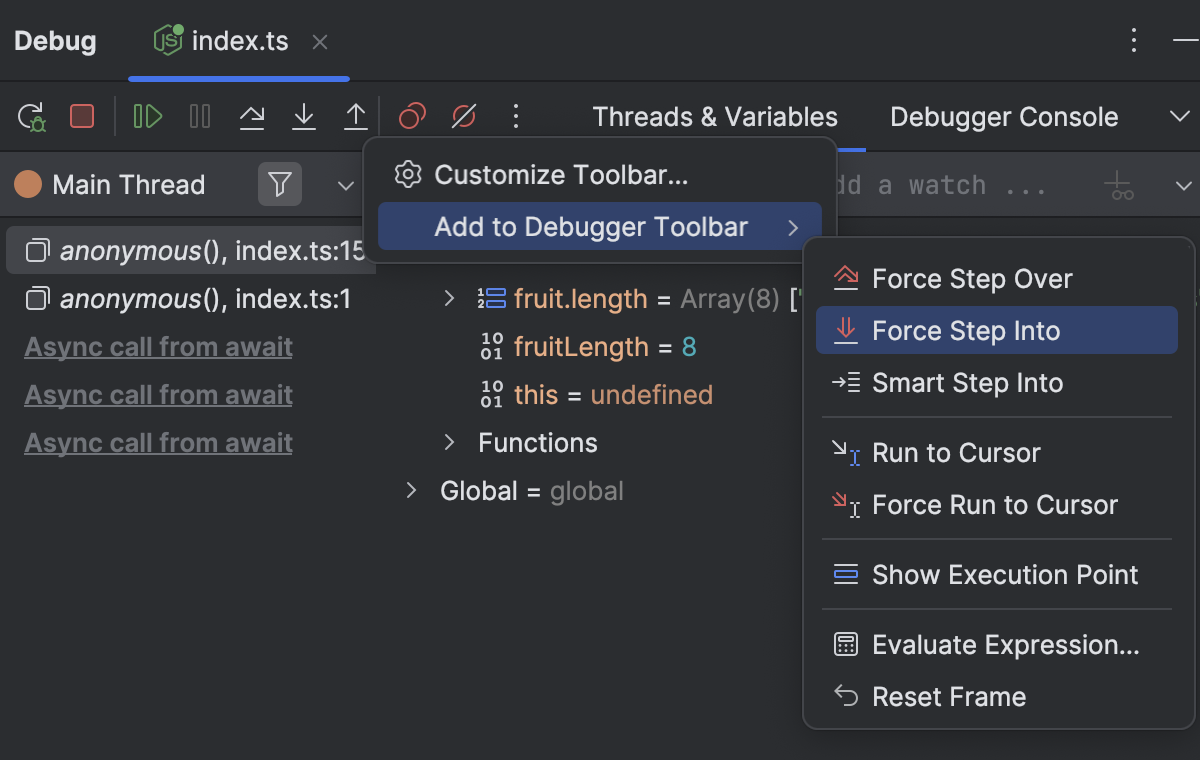
- To add a debugging action, right-click the debugger toolbar, select Add to Debugger Toolbar from the context menu, and then select the required action from the list.
- To add an action that is not directly related to debugging, right-click the debugger toolbar, and then select Customize Toolbar from the context menu.

In the dialog that opens, click Add, and then select the required action.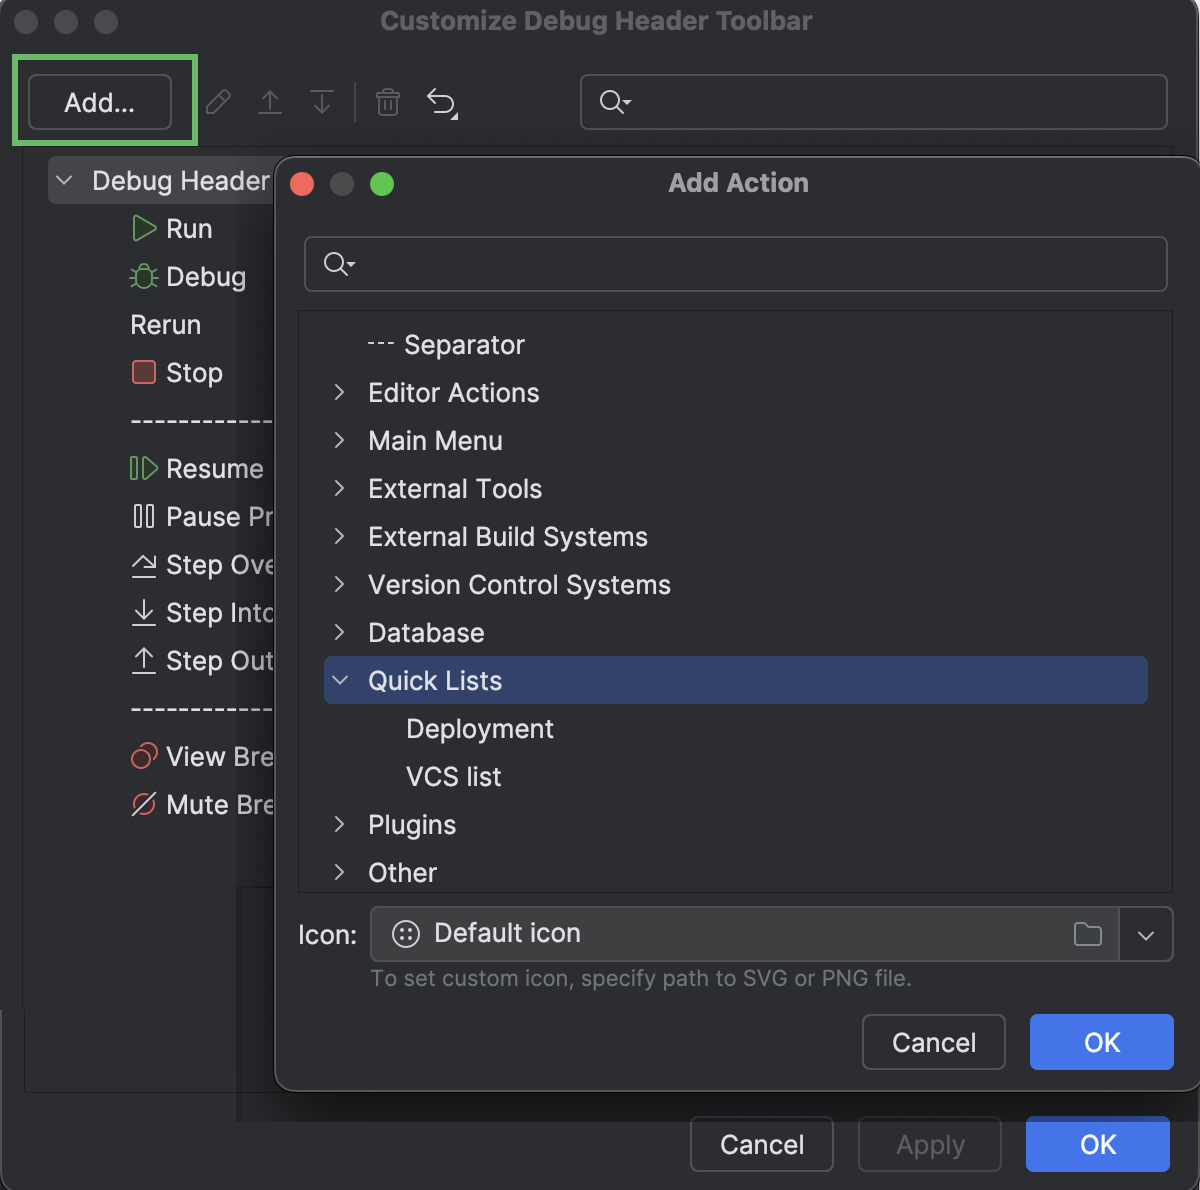
Last modified: 03 April 2025