gradCAM - Explain network predictions using Grad-CAM - MATLAB (original) (raw)
Explain network predictions using Grad-CAM
Since R2021a
Syntax
Description
[scoreMap](#mw%5F5e3257c4-c1e6-43e9-b2a4-e27b1eefebad) = gradCAM([net](#mw%5Fd8d40310-54b8-49e9-b3a8-64170066a2c5),[X](#mw%5F5aeffd5e-3371-42d4-92af-9912d0e955d4),[classIdx](#mw%5Fab3a9b30-6906-4b5f-ad94-9c0be6606d2c)) returns the gradient-weighted class activation mapping (Grad-CAM) map of the change in the classification score of input X, when the networknet evaluates the class score for the class given byclassIdx. Use this function to explain network predictions and check that your network is focusing on the right parts of the data.
The Grad-CAM interpretability technique uses the gradients of the classification score with respect to the final convolutional feature map. The parts of an observation with a large value for the Grad-CAM map are those that most impact the network score for that class.
Use this syntax to compute the Grad-CAM map for classification tasks.
[scoreMap](#mw%5F5e3257c4-c1e6-43e9-b2a4-e27b1eefebad) = gradCAM([net](#mw%5Fd8d40310-54b8-49e9-b3a8-64170066a2c5),[X](#mw%5F5aeffd5e-3371-42d4-92af-9912d0e955d4),[label](#mw%5F80c1fa98-d029-430d-ac4b-c5772098b574)) returns the Grad-CAM map using the class given by the class labellabel.
[scoreMap](#mw%5F5e3257c4-c1e6-43e9-b2a4-e27b1eefebad) = gradCAM([net](#mw%5Fd8d40310-54b8-49e9-b3a8-64170066a2c5),[X](#mw%5F5aeffd5e-3371-42d4-92af-9912d0e955d4),[reductionFcn](#mw%5Ff242e0f2-d54a-4020-bbf5-485f55a02df7)) returns the Grad-CAM importance map using a reduction function.reductionFcn is a function handle that reduces the output activations of the reduction layer to a scalar value. This scalar fulfills the role of the class score for classification tasks, and generalizes the Grad-CAM technique to nonclassification tasks, such as regression.
The gradCAM function computes the Grad-CAM map by differentiating the reduced output of the reduction layer with respect to the features in the feature layer. gradCAM automatically selects reduction and feature layers to use when computing the map. To specify these layers, use the'ReductionLayer' and 'FeatureLayer' name-value arguments.
Use this syntax to compute the Grad-CAM map for nonclassification tasks.
[[scoreMap](#mw%5F5e3257c4-c1e6-43e9-b2a4-e27b1eefebad),[featureLayer](#mw%5F0b79ef5d-83cc-449a-a38d-24d4b5027199),[reductionLayer](#mw%5Fbd700927-ace5-4330-838d-b0664113c04c)] = gradCAM(___) also returns the names of the feature layer and reduction layer used to compute the Grad-CAM map. Use this syntax with any of the input-argument combinations in previous syntaxes.
___ = gradCAM(___,[Name,Value](#namevaluepairarguments)) specifies options using one or more name-value arguments in addition to the input arguments in previous syntaxes. For example, ReductionLayer="prob" sets the reduction layer to the net layer named "prob".
Examples
Grad-CAM for Image Classification
Use gradCAM to visualize which parts of an image are important to the classification decision of a network.
Import the pretrained network SqueezeNet.
[net,classes] = imagePretrainedNetwork("squeezenet");
Import the image and resize it to match the input size for the network.
X = imread("laika_grass.jpg"); inputSize = net.Layers(1).InputSize(1:2); X = imresize(X,inputSize);
Display the image.
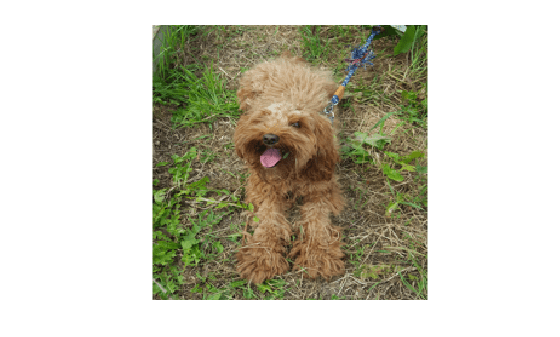
Classify the image to get the class label.
scores = predict(net,single(X)); label = scores2label(scores,classes)
label = categorical toy poodle
Use gradCAM to determine which parts of the image are important to the classification result. Specify the softmax layer in the network as the reduction layer.
scoreMap = gradCAM(net,X,label,ReductionLayer="prob");
Plot the result over the original image with transparency to see which areas of the image contribute most to the classification score.
figure imshow(X) hold on imagesc(scoreMap,AlphaData=0.5) colormap jet
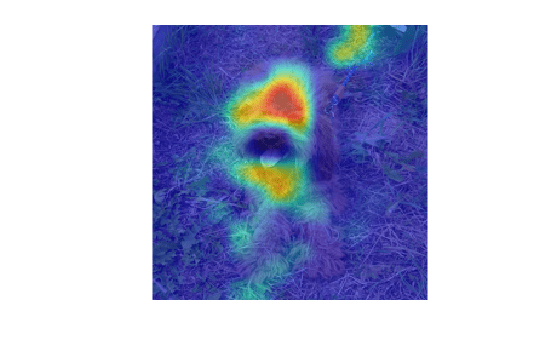
The network focuses predominantly on the back of the dog to make the classification decision.
Grad-CAM for Image Regression
Use Grad-CAM to visualize which parts of an image are most important to the predictions of an image regression network.
Load the pretrained network digitsRegressionNet. This network is a regression convolutional neural network that predicts the angle of rotation of handwritten digits.
View the network layers. The output layer of the network is a regression layer.
layers = 17x1 Layer array with layers:
 1   'imageinput'    Image Input           28x28x1 images with 'zerocenter' normalization
 2   'conv_1'        2-D Convolution       8 3x3x1 convolutions with stride [1  1] and padding 'same'
 3   'batchnorm_1'   Batch Normalization   Batch normalization with 8 channels
 4   'relu_1'        ReLU                  ReLU
 5   'avgpool2d_1'   2-D Average Pooling   2x2 average pooling with stride [2  2] and padding [0  0  0  0]
 6   'conv_2'        2-D Convolution       16 3x3x8 convolutions with stride [1  1] and padding 'same'
 7   'batchnorm_2'   Batch Normalization   Batch normalization with 16 channels
 8   'relu_2'        ReLU                  ReLU
 9   'avgpool2d_2'   2-D Average Pooling   2x2 average pooling with stride [2  2] and padding [0  0  0  0]
10   'conv_3'        2-D Convolution       32 3x3x16 convolutions with stride [1  1] and padding 'same'
11   'batchnorm_3'   Batch Normalization   Batch normalization with 32 channels
12   'relu_3'        ReLU                  ReLU
13   'conv_4'        2-D Convolution       32 3x3x32 convolutions with stride [1  1] and padding 'same'
14   'batchnorm_4'   Batch Normalization   Batch normalization with 32 channels
15   'relu_4'        ReLU                  ReLU
16   'dropout'       Dropout               20% dropout
17   'fc'            Fully Connected       1 fully connected layer
Load the test images.
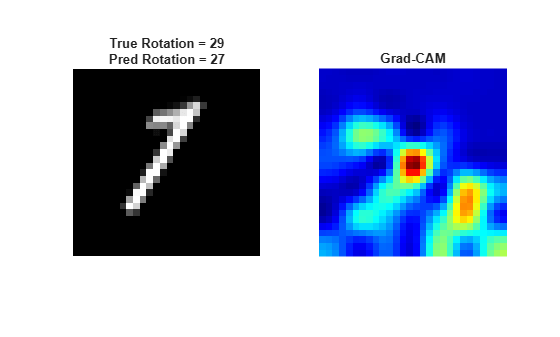
Evaluate the performance of the network on a test image.
testIdx = 501; testDigit = XTest(:,:,:,testIdx);
Use predict to predict the angle of rotation and compare the predicted rotation to the true rotation.
predRotation = predict(net,testDigit)
predRotation = single
26.5635
trueRotation = anglesTest(testIdx)
Visualize the regions of the image most important to the network prediction using gradCAM. Select the ReLU layer as the feature layer and the fully connected layer as the reduction layer.
featureLayer = 'relu_4'; reductionLayer = 'fc';
Define the reduction function. The reduction function must reduce the output of the reduction layer to a scalar value. The Grad-CAM map displays the importance of different parts of the image to that scalar. In this regression problem, the network predicts the angle of rotation of the image. Therefore, the output of the fully connected layer is already a scalar value and so the reduction function is just the identity function.
Compute the Grad-CAM map.
scoreMap = gradCAM(net,testDigit,reductionFcn, ... 'ReductionLayer',reductionLayer, ... 'FeatureLayer',featureLayer);
Display the Grad-CAM map over the test image.
ax(1) = subplot(1,2,1); imshow(testDigit) title("True Rotation = " + trueRotation + newline + "Pred Rotation = " + round(predRotation,0)) colormap(ax(1),'gray')
ax(2) = subplot(1,2,2); imshow(testDigit) hold on imagesc(rescale(scoreMap)) colormap(ax(2),'jet') title("Grad-CAM") hold off
Grad-CAM for Sequence Classification
Use gradCAM to visualize which parts of a sequence are important to the classification decision of a network.
Load the pretrained network JapaneseVowelsConvNet. This network is a pretrained 1-D convolutional neural network trained on the Japanese Vowels data set as described in [1] and [2].
load JapaneseVowelsConvNet
View the network architecture.
ans = 10x1 Layer array with layers:
 1   'sequenceinput'     Sequence Input               Sequence input with 12 dimensions
 2   'conv1d_1'          1-D Convolution              32 3x12 convolutions with stride 1 and padding 'causal'
 3   'relu_1'            ReLU                         ReLU
 4   'layernorm_1'       Layer Normalization          Layer normalization with 32 channels
 5   'conv1d_2'          1-D Convolution              64 3x32 convolutions with stride 1 and padding 'causal'
 6   'relu_2'            ReLU                         ReLU
 7   'layernorm_2'       Layer Normalization          Layer normalization with 64 channels
 8   'globalavgpool1d'   1-D Global Average Pooling   1-D global average pooling
 9   'fc'                Fully Connected              9 fully connected layer
10   'softmax'           Softmax                      softmax
Load the test data. XTest is a cell array containing sequences of dimension 12 of varying length. TTest is a categorical vector of labels "1","2",...,"9", which correspond to the nine speakers.
load JapaneseVowelsTestData
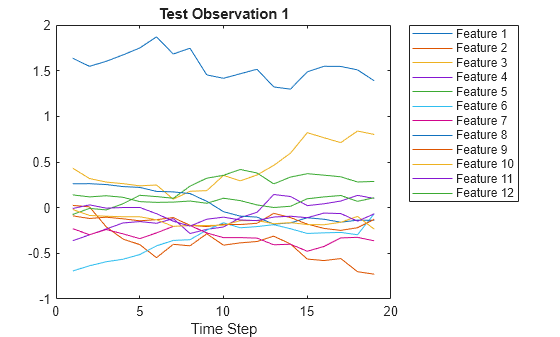
Select the first time series observation. This sequence has 19 time steps.
testSequence = XTest{1}; testSize = size(testSequence)
numFeatures = testSize(1);
Visualize the first time series in a plot. Each line corresponds to a feature.
figure plot(testSequence') title("Test Observation 1") xlabel("Time Step") legend("Feature " + string(1:numFeatures),'Location','northeastoutside')
Classify the test observation.
scores = predict(net,testSequence,InputDataFormats="CT"); label = scores2label(scores,categories(TTest))
Use gradCAM to determine which parts of the sequence are important to the classification result.
map = gradCAM(net,testSequence,label);
map is a 1-by-19 vector containing the importance value for each of the 19 time steps.
Plot the results to see which time steps contribute most to the classification score.
figure
subplot(2,1,1) plot(testSequence') xlabel("Time Step")
subplot(2,1,2) plot(map) xlabel("Time Step") ylabel("Grad-CAM Importance")
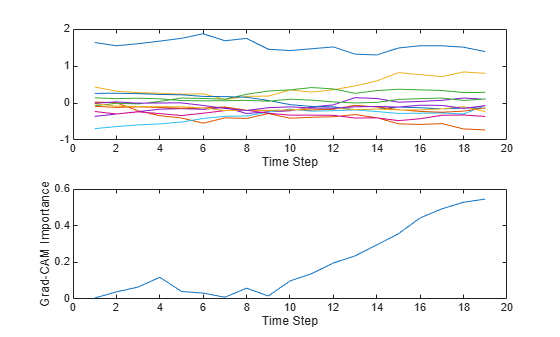
The Grad-CAM map suggests that the network is focusing on the later time steps to make the classification decision.
Input Arguments
X — Input data
numeric array | dlarray object
Input data, specified as a numeric array or formatted dlarray object.
- For 2-D image data,
Xmust be a_h_-by-_w_-by-c array, where h, w, and c are the height, width, and number of channels of the network input layer, respectively. - For 3-D image data,
Xmust be a_h_-by-_w_-by-d_-by-c array, where h, w, d, and_c are the height, width, depth, and number of the network input layer, respectively. - For vector sequence data,
Xmust be a_c_-by-t array, wherecis the input size of the network net andtis the number of time steps in the sequence and can be any positive integer.
Data Types: single | double | int8 | int16 | int32 | int64 | uint8 | uint16 | uint32 | uint64
classIdx — Class index
numeric scalar | numeric vector
Class index, specified as a numeric scalar or a numeric vector of class indices.
If classIdx is specified as a vector, then the feature importance map for each specified class is calculated independently. For more information, see scoreMap.
The gradCAM function sums over the spatial and time dimensions of the reduction layer for class `classIdx`. Therefore, you can specify `classIdx` as the classes of interest for semantic segmentation tasks and gradCAM returns the Grad-CAM importance for each pixel.
Example: [1 5]
Data Types: single | double | int8 | int16 | int32 | int64 | uint8 | uint16 | uint32 | uint64
label — Class label
categorical scalar | categorical vector
Class label, specified as a categorical scalar or a categorical vector of class labels.
If label is specified as a vector, then the feature importance map for each specified class is calculated independently. For more information, seescoreMap.
The gradCAM function sums over the spatial and time dimensions of the reduction layer for class `label`. Therefore, you can specify `label` as the classes of interest for semantic segmentation tasks and gradCAM returns the Grad-CAM importance for each pixel.
Data Types: categorical
reductionFcn — Reduction function
function handle
Reduction function, specified as a function handle. The reduction function reduces the output activations of the reduction layer to a single value and must reduce adlarray object to a dlarray scalar. This scalar fulfills the role of classIdx in classification tasks, and generalizes the Grad-CAM technique to nonclassification tasks, such as regression.
Grad-CAM uses the reduced output activations of the reduction layer to compute the gradients for the importance map.
Example: @x(x)
Data Types: function_handle
Name-Value Arguments
Specify optional pairs of arguments asName1=Value1,...,NameN=ValueN, where Name is the argument name and Value is the corresponding value. Name-value arguments must appear after other arguments, but the order of the pairs does not matter.
Before R2021a, use commas to separate each name and value, and enclose Name in quotes.
Example: FeatureLayer="conv10",ReductionLayer="prob",OutputUpsampling="bicubic",ExecutionEnvironment="gpu" computes the Grad-CAM map with respect to layers conv10 andprob, executes the calculation on the GPU, and upsamples the resulting map to the same size as the input data using bicubic interpolation.
FeatureLayer — Name of feature layer
string | character vector
Name of the feature layer to extract the feature map from when computing the Grad-CAM map, specified as a string or character vector. The feature layer must have the same data format as the input layer. For more information about data format, seeInputDataFormats. For most tasks, use the last ReLU layer with nonsingleton spatial or time dimensions, or the last layer that gathers the outputs of ReLU layers (such as depth concatenation or addition layers). If your network does not contain any ReLU layers, specify the name of the final convolutional layer that has nonsingleton spatial or time dimensions in the output.
The default value is the final layer with the same data format as the input layer and nonsingleton spatial or time dimensions. Use theanalyzeNetwork function to examine your network and select the correct layer.
Example: FeatureLayer="conv10"
Data Types: char | string
ReductionLayer — Name of reduction layer
string | character vector
Name of the reduction layer to extract output activations from when computing the Grad-CAM map, specified as a string or character vector.
The default value is the final layer in the network. Use theanalyzeNetwork function to examine your network and select the correct layer.
Example: ReductionLayer="prob"
Data Types: char | string
InputDataFormats — Input data format
character vector | string
Input data format assigning a label to each dimension of the input data, specified as a character vector or a string. Each character in the format must be one of the following dimension labels:
S— SpatialC— ChannelB— BatchT— Time
For more information, see dlarray.
The gradCAM function supports at most one singleton batch dimension.
Example: InputDataFormats="TC"
Data Types: char | string
OutputUpsampling — Output upsampling method
"bicubic" (default) | "nearest" | "none"
Output upsampling method, specified as:
"bicubic"— Use bicubic interpolation to produce a smooth map."nearest"— Use nearest-neighbor interpolation to expand the map."none"— Use no upsampling. The map can be smaller or larger than the input data.
If OutputUpsampling is "nearest" or"bicubic", the Grad-CAM map is the same size as the spatial and temporal dimensions of the input.
- For 2-D image data, the map is size_h_-by-w, where h and_w_ are the height and width of the image, respectively
- For 3-D image data, the map is size_h_-by-w_-by-d, where_h, w, and d are the height, width, and depth of the image, respectively.
- For vector sequence input, the map is size 1-by-t, where_t_ is the number of time steps in the sequence.
If OutputUpsampling is "nearest" or"bicubic", the computed map is upsampled using the imresize function for 2-D image and vector sequence data, and the imresize3 (Image Processing Toolbox) function for 3-D image data. For 3-D image data, the option"bicubic" uses imresize3 (Image Processing Toolbox) with the "cubic" method.
Example: OutputUpsampling="bicubic"
ExecutionEnvironment — Hardware resource
"auto" (default) | "gpu" | "cpu"
Hardware resource, specified as one of these values:
"auto"— Use a GPU if one is available. Otherwise, use the CPU."gpu"— Use the GPU. Using a GPU requires a Parallel Computing Toolbox™ license and a supported GPU device. For information about supported devices, seeGPU Computing Requirements (Parallel Computing Toolbox). If Parallel Computing Toolbox or a suitable GPU is not available, then the software returns an error."cpu"— Use the CPU.
Output Arguments
scoreMap — Grad-CAM importance map
row vector | numeric array
Grad-CAM importance map, returned as a row vector or a numeric array. Areas in the map with higher positive values correspond to regions of input data that contribute positively to the prediction.
- For classification tasks,
scoreMapis the gradient of the final classification score for the specified class, with respect to each feature in the feature layer. - For other types of tasks,
scoreMapis the gradient of the reduced output of the reduction layer, with respect to each feature in the feature layer.
The size of scoreMap depends on the type of data.
- For 2-D image data,
scoreMapis a matrix.scoreMap(i,j)corresponds to the Grad-CAM importance at the spatial location(i,j). For example, if you provideclassIdxas a vector, thenscoreMap(:,:,n)corresponds to the map forclassIdx(n). - For 3-D image data,
scoreMapis a 3-D array.scoreMap(i,j,k)corresponds to the Grad-CAM importance at the spatial location(i,j,k). For example, if you provideclassIdxas a vector, thenscoreMap(:,:,:,n)corresponds to the map forclassIdx(n). - For vector sequence data,
scoreMapis a row vector.scoreMap(:,i)corresponds to the Grad-CAM importance at time stepi. For example, if you provideclassIdxas a vector, thenscoreMap(:,:,n)corresponds to the map forclassIdx(n).
featureLayer — Name of feature layer
string
Name of the feature layer to extract the feature map from when computing the Grad-CAM map, returned as a string.
By default, gradCAM chooses a feature layer to use to compute the Grad-CAM map. This layer is the final layer with the same data format as the input layer and with nonsingleton spatial or time dimensions. You can specify which feature layer to use using the FeatureLayer name-value argument. When you specify the FeatureLayer name-value argument,featureLayer returns the same value.
reductionLayer — Name of reduction layer
string
Name of the reduction layer to extract output activations from when computing the Grad-CAM map, returned as a string.
By default, gradCAM chooses a reduction layer to use to compute the Grad-CAM map. This layer is the final layer in dlnetwork objects. You can also specify which reduction layer to use using theReductionLayer name-value argument. When you specify theReductionLayer name-value argument,reductionLayer returns the same value.
More About
Grad-CAM
Gradient-weighted class activation mapping (Grad-CAM) is an explainability technique that can be used to help understand the predictions made by a deep neural network [3]. Grad-CAM, a generalization of the CAM technique, determines the importance of each neuron in a network prediction by considering the gradients of the target flowing through the deep network.
Grad-CAM computes the gradient of a differentiable output, for example class score, with respect to the convolutional features in the chosen layer. The gradients are pooled over space and time dimensions to find the neuron importance weights. These weights are then used to linearly combine the activation maps and determine which features are most important to the prediction.
Suppose you have a 2-D image classification network with output_yc_, representing the score for class_c_, and want to compute the Grad-CAM map for a convolutional layer with_k_ feature maps (channels),Aki,j, where_i,j_ indexes the pixels. The neuron importance weight is
where N is the total number of pixels in the feature map. The Grad-CAM map is then a weighted combination of the feature maps with an applied ReLU:
The ReLU activation ensures you get only the features that have a positive contribution to the class of interest. The output is therefore a heatmap for the specified class, which is the same size as the feature map. The Grad-CAM map is then upsampled to the size of the input data.
Although Grad-CAM is commonly used for classification tasks, you can compute a Grad-CAM map for any differentiable activation. For example, for semantic segmentation tasks, you can calculate the Grad-CAM map by replacing yc with ∑(i,j)∈Syijc, where S is the set of pixels of interest and_yi,jc_ is 1 if pixel_(i,j)_ is predicted to be class c, and 0 otherwise[4]. You can use thegradCAM function for nonclassification tasks by specifying a suitable reduction function that reduces the output activations of the reduction layer to a single value and takes the place of yc in the neuron importance weight equation.
Tips
- The
reductionFcnfunction receives the output from the reduction layer as a traceddlarrayobject. The function must reduce this output to a scalardlarray, whichgradCAMthen differentiates with respect to the activations of the feature layer. For example, to compute the Grad-CAM map for channel 208 of the softmax activations of a network, the reduction function is@(x)(x(208)). This function receives the activations and extracts the 208th channel. - The
gradCAMfunction automatically chooses reduction and feature layers to use when computing the Grad-CAM map. For some networks, the chosen layers might not be suitable. For example, if your network has multiple layers that can be used as the feature layer, then the function chooses one of those layers, but its choice might not be the most suitable. For such networks, specify which feature layer to use using theFeatureLayername-value argument. - To display the Grad-CAM map as an overlay on a grayscale image, you must first rescale the map to be in the range [0, 1]. For example,
scoreMapRescaled = rescale(scoreMap);.
References
[1] Kudo, Mineichi, Jun Toyama, and Masaru Shimbo. “Multidimensional Curve Classification Using Passing-through Regions.” Pattern Recognition Letters 20, no. 11–13 (November 1999): 1103–11. https://doi.org/10.1016/S0167-8655(99)00077-X.
[2] UCI Machine Learning Repository: Japanese Vowels Dataset. https://archive.ics.uci.edu/ml/datasets/Japanese+Vowels.
[3] Selvaraju, Ramprasaath R., Michael Cogswell, Abhishek Das, Ramakrishna Vedantam, Devi Parikh, and Dhruv Batra. “Grad-CAM: Visual Explanations from Deep Networks via Gradient-Based Localization.” 2017 (October 2017): 618–626, https://doi.org/10.1109/ICCV.2017.74\.
[4] Vinogradova, Kira, Alexandr Dibrov, and Gene Myers. “Towards Interpretable Semantic Segmentation via Gradient-Weighted Class Activation Mapping.” Proceedings of the AAAI Conference on Artificial Intelligence 34, no. 10 (April 2020): 13943–13944, https://doi.org/10.1609/aaai.v34i10.7244.
Extended Capabilities
GPU Arrays
Accelerate code by running on a graphics processing unit (GPU) using Parallel Computing Toolbox™.
The gradCAM function fully supports GPU arrays. To run the function on a GPU, specify the input data as a gpuArray (Parallel Computing Toolbox). For more information, see Run MATLAB Functions on a GPU (Parallel Computing Toolbox).
Version History
Introduced in R2021a
R2024a: DAGNetwork and SeriesNetwork objects are not recommended
DAGNetwork and SeriesNetwork objects are not recommended. Use dlnetwork objects instead.
The syntax scoreMap = gradCAM(net,X,label) withlabel specified as a character array or a string array is supported for DAGNetwork and SeriesNetwork objects only. To use adlnetwork object with the gradCAM function, you must specify the channel index or a categorical instead.
Use the trainnet function to create a dlnetwork object. To convert an existing DAGNetwork or SeriesNetwork object to a dlnetwork object, use the dag2dlnetwork function.
This table shows an example of how to convert code that uses aDAGNetwork object with the class label specified as a string to code that uses a dlnetwork object and a class index. You can use the same syntaxes to convert a SeriesNetwork object.
| Not recommended (DAGNetwork object) | Recommended (dlnetwork object) |
|---|---|
| map = gradCAM(DAGnet,X,label); | net = dag2dlnetwork(DAGnet); classIdx = find(label == classNames); map = gradCAM(net,X,classIdx);classNames contains the classes on which the network was trained. For example, you can extract the class names from a trained classificationDAGNetwork using this code.classNames = DAGnet.Layers(end).Classes; |
R2024a: Format option of gradcam not recommended
The Format option of the gradCAM function is not recommended. Use InputDataFormats instead. To update your code, replace all instances of Format withInputDataFormats.