gpuPerformanceAnalyzer - Analyze and optimize performance of the generated
code - MATLAB ([original](https://www.mathworks.com/help/gpucoder/ref/gpuperformanceanalyzer.html)) ([raw](?raw))Analyze and optimize performance of the generated code
Since R2023a
Syntax
Description
gpuPerformanceAnalyzer([fcn](#mw%5F4c97afa3-582a-42d3-814c-c6c0787c5e02), [fcn_inputs](#mw%5Fde22c3af-ec9c-420a-9887-84288489cedd)) generates GPU code for the MATLAB® entry-point function fcn and analyzes performance through code execution profiling plots and reports. fcn_inputs is a cell array of example values tofcn used during code generation and execution profiling.
Note
The profiling workflow depends on profiling tools from NVIDIA®. From CUDA® Toolkit v10.1 onwards, NVIDIA restricts access to performance counters to admin users. To enable GPU performance counters for all user accounts, see the instructions in Permission issue with Performance Counters (NVIDIA).
Note
The profiling tools from NVIDIA might not support legacy GPU hardware such as the Kepler family of devices. For information on supported GPU devices, see the NVIDIA documentation.
gpuPerformanceAnalyzer(___,[Name=Value](#namevaluepairarguments)) generates GPU code and analyzes performance through code execution profiling plots and reports by using the options specified by one or moreName=Value pair arguments.
Examples
Analyze Performance of Code Generated for Mandelbrot Set
This example shows how to analyze the performance of the CUDA code generated for the Mandelbrot algorithm by usinggpuPerformanceAnalyzer.
The Mandelbrot set is the region in the complex plane consisting of the values_z_ 0 for which the trajectories defined by this equation remain bounded at k→∞.
The overall geometry of the Mandelbrot set is shown in the figure. This view does not have the resolution to show the richly detailed structure of the fringe just outside the boundary of the set. At increasing magnifications, the Mandelbrot set exhibits an elaborate boundary that reveals progressively finer recursive detail.
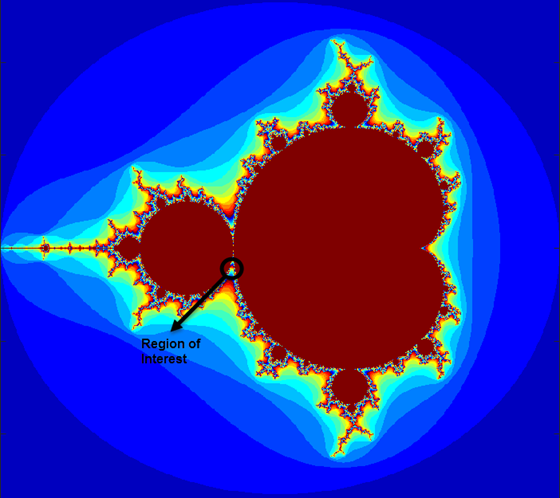
For this example, pick a set of limits that specify a highly zoomed part of the Mandelbrot set in the valley between the main cardioid and the p/q bulb to its left. A 1000-by-1000 grid of real parts (x) and imaginary parts (y) is created between these two limits. The Mandelbrot algorithm is then iterated at each grid location. An iteration number of 500 renders the image in full resolution.
maxIterations = 500; gridSize = 1000; xlim = [-0.748766713922161,-0.748766707771757]; ylim = [0.123640844894862,0.123640851045266];
x = linspace( xlim(1), xlim(2), gridSize ); y = linspace( ylim(1), ylim(2), gridSize ); [xGrid,yGrid] = meshgrid( x, y );
The mandelbrot_count.m entry-point function contains a vectorized implementation of the Mandelbrot set.
function count = mandelbrot_count(maxIterations, xGrid, yGrid) %#codegen
z0 = complex(xGrid,yGrid); count = ones(size(z0));
% Map computation to GPU. coder.gpu.kernelfun;
z = z0; for n = 0:maxIterations z = z.*z + z0; inside = abs(z)<=2; count = count + inside; end count = log(count);
To generate CUDA code for mandelbrot_count and analyze its performance, use thegpuPerformanceAnalyzer function.
cfg = coder.gpuConfig('dll'); cfg.GpuConfig.CompilerFlags = '--fmad=false'; cfg.GpuConfig.EnableMemoryManager = true;
gpuPerformanceAnalyzer('mandelbrot_count', ... {maxIterations,xGrid,yGrid},Config=cfg, ... NumIterations=2,OutFolder="PerfTest");
Starting GPU code generation
Code generation successful: View report
GPU code generation finished
Starting SIL execution for 'mandelbrot_count'
To terminate execution: clear mandelbrot_count_silStopping SIL execution for 'mandelbrot_count'
Starting profiling data processing
Profiling data processing finished
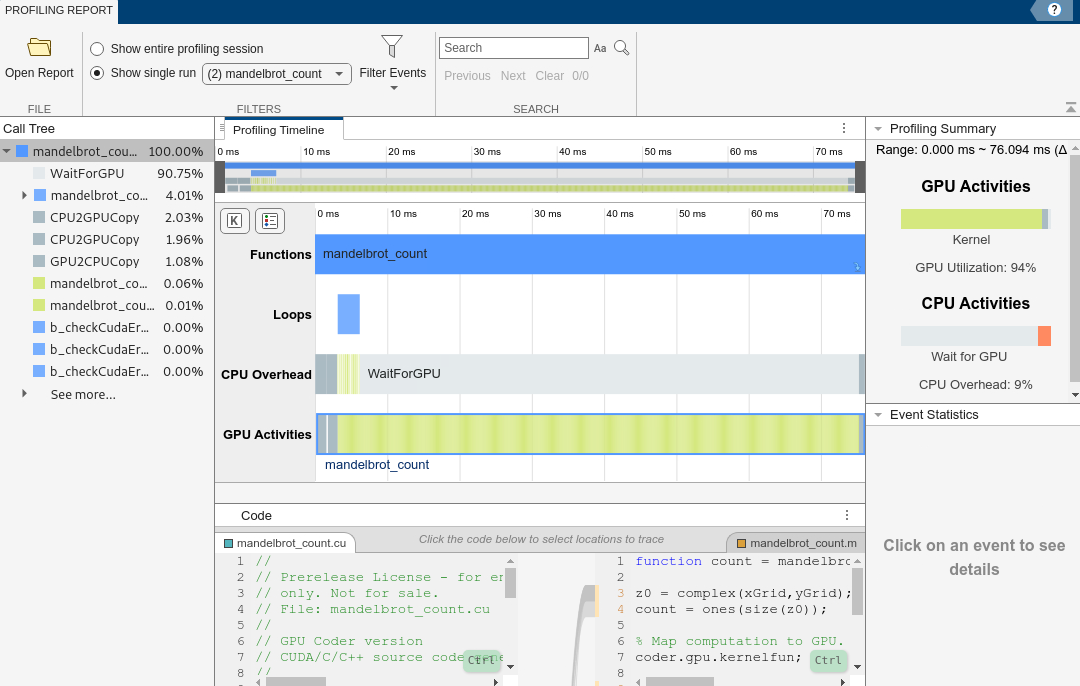
Showing profiling data
After collecting the profiling data, the gpuPerformanceAnalyzer launches the GPU Performance Analyzer report window.
Input Arguments
fcn — Name of MATLAB function to generate code from and analyze performance
character vector | string scalar
Specified as a function existing in the current working folder or on the path. If the MATLAB file is on a path that contains non 7-bit ASCII characters, such as Japanese characters, the gpuPerformanceAnalyzer command might not find the file.
Example: gpuPerformanceAnalyzer('foo.m', {rand(5,10)});
fcn_inputs — Example values for MATLAB function inputs
expression | variable | literal value
Example values that define the size, class, and complexity of the inputs of the preceding MATLAB function. The position of the input in the cell array must correspond to the position of the input argument in the MATLAB function definition. Alternatively, instead of an example value, you can provide a coder.Type object. To create a coder.Type object, usecoder.typeof.
To generate a function that has fewer input arguments than the function definition has, omit the example values for the arguments that you do not want.
Example: gpuPerformanceAnalyzer('foo.m', {rand(5,10)});
Name-Value Arguments
Specify optional pairs of arguments asName1=Value1,...,NameN=ValueN, where Name is the argument name and Value is the corresponding value. Name-value arguments must appear after other arguments, but the order of the pairs does not matter.
Before R2021a, use commas to separate each name and value, and enclose Name in quotes.
Example: gpuPerformanceAnalyzer('foo.m', {rand(5,10)}, Config=cfg, NumIterations=2, OutFolder="PerfTest");
InputTypes — Properties of the inputs
cell array
Specify the properties (size, class, and complexity) for the entry-point function inputs used during code generation. If this value is empty, the code generator interprets the input properties from fcn_inputs.
Example: gpuPerformanceAnalyzer('foo.m', {rand(5,10)}, InputTypes= {coder.typeof(ones(5,10))});
Config — Code configuration object
coder.MexCodeConfig object | coder.EmbeddedCodeConfig object
Specify the configuration object that contains the code generation parameters:
- For CUDA MEX generation, specify a
coder.MexCodeConfigobject. - For CUDA standalone library or executable generation, specify a
coder.EmbeddedCodeConfigobject.
By default, gpuPerformanceAnalyzer uses a GPU code generation configuration object for dynamic linked library (dll).
Example: gpuPerformanceAnalyzer('foo.m', {rand(5,10)}, Config=coder.gpuconfig('dll'));
NumIterations — Number of iterations
2 (default) | positive integer
Specify the number of times to execute the generated code. The value for'NumIterations' name-value pair must be a positive integer greater than or equal to 1.
By default, the View Mode of the GPU Performance Analyzer window is set to and the Profiling Timeline shows only the last execution of the generated code. To view all the iterations, set the View Mode to .
Example: gpuPerformanceAnalyzer('foo.m', {rand(5,10)},NumIterations=2);
OutFolder — Location of generated files
codegen/_`target`_/_`fcnname`_ (default) | character vector | string scalar
Store generated files in the absolute or relative path specified by the'Outfolder' name-value pair argument. Value for'Outfolder' must not contain:
- Spaces, as spaces can lead to code generation failures in certain operating system configurations.
- Non 7-bit ASCII characters, such as Japanese characters,
If the folder specified by the 'Outfolder' name-value pair argument does not exist, gpuPerformanceAnalyzer creates it.
If you do not specify the folder location,gpuPerformanceAnalyzer generates files in the default folder:
target can be:
mexfor CUDA MEXlibfor CUDA librariesdllfor CUDA dynamic libraries
fcnname is the name of the MATLAB function.
The function does not support the following characters in folder names: asterisk (*), question-mark (?), dollar ($), and pound (#).
Note
Each time gpuPerformanceAnalyzer generates the same type of output for the same code, it removes the files from the previous build. If you want to preserve files from a previous build, before starting another build, copy them to a different location.
Example: gpuPerformanceAnalyzer('foo.m', {rand(5,10)}, OutFolder="PerfTest");
Version History
Introduced in R2023a
See Also
Functions
Objects
Topics
- Analyze Performance of Generated CUDA Code
- GPU Profiling on NVIDIA Jetson Platforms
- Analyze Performance of Code Generated for Deep Learning Networks
- GPU Programming Paradigm
- Generate Code by Using the GPU Coder App
- Generate Code Using the Command Line Interface
- Code Generation for Deep Learning Networks by Using cuDNN
- Code Generation for Deep Learning Networks by Using TensorRT