Access Data in Tables - MATLAB & Simulink (original) (raw)
A table is a container that stores column-oriented data in variables. To access the data in a table, you can index into the table by specifying rows and variables, just as you can index into a matrix by specifying rows and columns. Table variables have names, just as the fields of a structure have names. The rows of a table also can have names, but row names are not required. To index into a table, specify rows and variables using either positions, names, or data types. The result can be either an array or a table.
This topic describes the different table indexing syntaxes and when to use each type. Additional examples show the different ways to apply these table indexing types. The table at the end of the topic summarizes the indexing syntaxes, how to specify rows and variables, and the resulting outputs.
Table Indexing Syntaxes
Depending on the type of indexing you use, the result is either an array extracted from the table or a new table. Indexing with:
- Dot notation, as in
T._`varname`_orT.(_`expression`_), extracts an array from one table variable. - Curly braces, as in
T{_`rows`_,_`vars`_}, extract an array from the specified rows and variables. The variables must have compatible data types so that they can be concatenated into one array. - Parentheses, as in
T(_`rows`_,_`vars`_), return a table that has only the specified rows and variables.
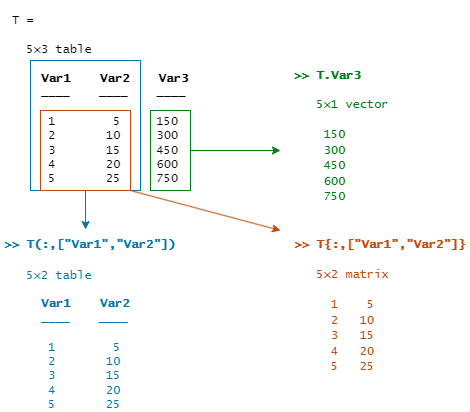
This diagram shows the three types of table indexing.
Recommended Indexing Syntaxes
The recommended way to access the contents of a table depends on the result you want and the number of variables that you specify. In these syntax examples,T is a table that has variables named Var1,Var2, and Var3. (If you do not specify variable names when calling the table function, then these names are the default names.)
T = table([1;2;3;4;5],[5;10;15;20;25],[150;300;450;600;750])
- To access one table variable, use dot notation. Specify a variable name or an expression that matches the name or position of a variable.
Using literal names of variables is faster than using expressions. For example,T.Var1andT.(1)both access the first variable ofT, but using the expression is slower.
X = T.Var1
Y = T.Var1(1:3)
Z = T.(1)
T.Var1 = T.Var1 .* 10
You can also specify one variable using curly braces. However, accessing a variable using dot notation is faster than accessing a variable using curly braces. - To access multiple table variables, use curly braces.
X = T{:,["Var1","Var2"]}
Y = T{1:3,["Var1","Var2"]}
T{:,["Var1","Var2"]} = T{:,["Var1","Var2"]} .* 10 - To return a table that has only specified rows and variables, use parentheses.
T2 = T(:,["Var1","Var2"])
T2 = T(1:3,["Var1","Var2"])
A = rand(5,1)
B = rand(5,1)
T(:,["Var1","Var2"]) = table(A,B)
Index by Specifying Rows and Variables
You can index into tables by specifying numeric indices, row and variable names, or variable data types.
Create a table. Load arrays of data from the sample patients.mat file. Then create a table from these arrays using the table function. The names of the input arrays become the names of the table variables. Row names are optional. To specify row names, use the RowNames name-value argument.
load patients.mat Age Height Weight Smoker LastName T = table(Age,Height,Weight,Smoker,RowNames=LastName)
T=100×4 table Age Height Weight Smoker ___ ______ ______ ______
Smith       38       71       176      true
Johnson     43       69       163      false
Williams    38       64       131      false
Jones       40       67       133      false
Brown       49       64       119      false
Davis       46       68       142      false
Miller      33       64       142      true
Wilson      40       68       180      false
Moore       28       68       183      false
Taylor      31       66       132      false
Anderson    45       68       128      false
Thomas      42       66       137      false
Jackson     25       71       174      false
White       39       72       202      true
Harris      36       65       129      false
Martin      48       71       181      true
  ⋮
Index by Position
You can index into tables by specifying positions as numeric indices. You can also use colons and the end keyword.
For example, index into the first three rows of T. This syntax is a compact way to return a table with the specified number of rows.
firstRows=3×4 table Age Height Weight Smoker ___ ______ ______ ______
Smith       38       71       176      true
Johnson     43       69       163      false
Williams    38       64       131      false
Return a table with the first two variables and the last three rows of T.
lastRows = T(end-2:end,1:2)
lastRows=3×2 table Age Height ___ ______
Griffin    49       70
Diaz       45       68
Hayes      48       66
If the variables have compatible data types, then you can use curly braces to return the extracted data as an array.
lastRowsAsArray = T{end-2:end,1:2}
lastRowsAsArray = 3×2
49    70
45    68
48    66
Index by Variable Names
You can index into tables by specifying variable names using a string array. Table variable names do not have to be valid MATLAB® identifiers. They can include spaces and non-ASCII characters, and can start with any character.
For example, return a table that has only the first three rows of T and the Height and Weight variables.
variablesByName = T(1:3,["Height","Weight"])
variablesByName=3×2 table Height Weight ______ ______
Smith         71       176
Johnson       69       163
Williams      64       131
Use curly braces to return the data as an array.
arraysFromVariables = T{1:3,["Height","Weight"]}
arraysFromVariables = 3×2
71   176
69   163
64   131
You can also use dot notation to index into one variable. In fact, dot notation is more efficient when you access just one variable.
heightAsArray = 100×1
71
69
64
67
64
68
64
68
68
66
  ⋮
Use dot notation to return the first three rows of the Height variable as an array.
firstHeights = T.Height(1:3)
firstHeights = 3×1
71
69
64
Index by Row Names
If a table has row names, you can index into it by row name, not just by row number. For example, return rows of T for three specific patients.
rowsByName = T(["Griffin","Diaz","Hayes"],:)
rowsByName=3×4 table Age Height Weight Smoker ___ ______ ______ ______
Griffin    49       70       186      false
Diaz       45       68       172      true
Hayes      48       66       177      false
You can also use curly braces to return the data as an array.
arraysFromRows = T{["Griffin","Diaz","Hayes"],:}
arraysFromRows = 3×4
49    70   186     0
45    68   172     1
48    66   177     0
Index into One Element
To index into one element of a table, specify one row and one variable. Use curly braces to return the element as an array, a scalar value in this case.
oneElement = T{"Diaz","Height"}
To return that element as a table with one row and one variable, use parentheses.
oneElementTable = T("Diaz","Height")
oneElementTable=table Height ______
Diaz 68 Index by Variable Data Type
To index into a table by specifying variables that have the same data type, create a data type subscript using the vartype function.
For example, create a data type subscript to match numeric table variables.
numSubscript = vartype("numeric")
numSubscript = table vartype subscript:
Select table variables matching the type 'numeric'Return a table that has only the numeric variables of T. The Smoker variable is not included because it is a logical variable.
onlyNumVariables = T(:,numSubscript)
onlyNumVariables=100×3 table Age Height Weight ___ ______ ______
Smith       38       71       176
Johnson     43       69       163
Williams    38       64       131
Jones       40       67       133
Brown       49       64       119
Davis       46       68       142
Miller      33       64       142
Wilson      40       68       180
Moore       28       68       183
Taylor      31       66       132
Anderson    45       68       128
Thomas      42       66       137
Jackson     25       71       174
White       39       72       202
Harris      36       65       129
Martin      48       71       181
  ⋮
Assign Values to Table
You can use any indexing syntax to assign values to a table. You can assign values to variables, rows, or individual elements.
Assign Values to Variables
Import power outage data from a spreadsheet into a table using the readtable function.
outages = readtable("outages.csv",TextType="string")
outages=1468×6 table
Region OutageTime Loss Customers RestorationTime Cause
___________ ________________ ______ __________ ________________ _________________
"SouthWest"    2002-02-01 12:18    458.98    1.8202e+06    2002-02-07 16:50    "winter storm"
"SouthEast"    2003-01-23 00:49    530.14    2.1204e+05                 NaT    "winter storm"
"SouthEast"    2003-02-07 21:15     289.4    1.4294e+05    2003-02-17 08:14    "winter storm"
"West"         2004-04-06 05:44    434.81    3.4037e+05    2004-04-06 06:10    "equipment fault"
"MidWest"      2002-03-16 06:18    186.44    2.1275e+05    2002-03-18 23:23    "severe storm"
"West"         2003-06-18 02:49         0             0    2003-06-18 10:54    "attack"
"West"         2004-06-20 14:39    231.29           NaN    2004-06-20 19:16    "equipment fault"
"West"         2002-06-06 19:28    311.86           NaN    2002-06-07 00:51    "equipment fault"
"NorthEast"    2003-07-16 16:23    239.93         49434    2003-07-17 01:12    "fire"
"MidWest"      2004-09-27 11:09    286.72         66104    2004-09-27 16:37    "equipment fault"
"SouthEast"    2004-09-05 17:48    73.387         36073    2004-09-05 20:46    "equipment fault"
"West"         2004-05-21 21:45    159.99           NaN    2004-05-22 04:23    "equipment fault"
"SouthEast"    2002-09-01 18:22    95.917         36759    2002-09-01 19:12    "severe storm"
"SouthEast"    2003-09-27 07:32       NaN    3.5517e+05    2003-10-04 07:02    "severe storm"
"West"         2003-11-12 06:12    254.09    9.2429e+05    2003-11-17 02:04    "winter storm"
"NorthEast"    2004-09-18 05:54         0             0                 NaT    "equipment fault"
  ⋮
To assign values to one variable, use dot notation. For example, scale the Loss variable by a factor of 100.
outages.Loss = outages.Loss .* 100
outages=1468×6 table
Region OutageTime Loss Customers RestorationTime Cause
___________ ________________ ______ __________ ________________ _________________
"SouthWest"    2002-02-01 12:18     45898    1.8202e+06    2002-02-07 16:50    "winter storm"
"SouthEast"    2003-01-23 00:49     53014    2.1204e+05                 NaT    "winter storm"
"SouthEast"    2003-02-07 21:15     28940    1.4294e+05    2003-02-17 08:14    "winter storm"
"West"         2004-04-06 05:44     43481    3.4037e+05    2004-04-06 06:10    "equipment fault"
"MidWest"      2002-03-16 06:18     18644    2.1275e+05    2002-03-18 23:23    "severe storm"
"West"         2003-06-18 02:49         0             0    2003-06-18 10:54    "attack"
"West"         2004-06-20 14:39     23129           NaN    2004-06-20 19:16    "equipment fault"
"West"         2002-06-06 19:28     31186           NaN    2002-06-07 00:51    "equipment fault"
"NorthEast"    2003-07-16 16:23     23993         49434    2003-07-17 01:12    "fire"
"MidWest"      2004-09-27 11:09     28672         66104    2004-09-27 16:37    "equipment fault"
"SouthEast"    2004-09-05 17:48    7338.7         36073    2004-09-05 20:46    "equipment fault"
"West"         2004-05-21 21:45     15999           NaN    2004-05-22 04:23    "equipment fault"
"SouthEast"    2002-09-01 18:22    9591.7         36759    2002-09-01 19:12    "severe storm"
"SouthEast"    2003-09-27 07:32       NaN    3.5517e+05    2003-10-04 07:02    "severe storm"
"West"         2003-11-12 06:12     25409    9.2429e+05    2003-11-17 02:04    "winter storm"
"NorthEast"    2004-09-18 05:54         0             0                 NaT    "equipment fault"
  ⋮
You can also assign data to multiple variables by using curly braces. The variables must have compatible data types. For example, scale Loss and Customers by a factor of 1/10,000.
outages{:,["Loss","Customers"]} = outages{:,["Loss","Customers"]} ./ 10000
outages=1468×6 table
Region OutageTime Loss Customers RestorationTime Cause
___________ ________________ _______ _________ ________________ _________________
"SouthWest"    2002-02-01 12:18     4.5898     182.02      2002-02-07 16:50    "winter storm"
"SouthEast"    2003-01-23 00:49     5.3014     21.204                   NaT    "winter storm"
"SouthEast"    2003-02-07 21:15      2.894     14.294      2003-02-17 08:14    "winter storm"
"West"         2004-04-06 05:44     4.3481     34.037      2004-04-06 06:10    "equipment fault"
"MidWest"      2002-03-16 06:18     1.8644     21.275      2002-03-18 23:23    "severe storm"
"West"         2003-06-18 02:49          0          0      2003-06-18 10:54    "attack"
"West"         2004-06-20 14:39     2.3129        NaN      2004-06-20 19:16    "equipment fault"
"West"         2002-06-06 19:28     3.1186        NaN      2002-06-07 00:51    "equipment fault"
"NorthEast"    2003-07-16 16:23     2.3993     4.9434      2003-07-17 01:12    "fire"
"MidWest"      2004-09-27 11:09     2.8672     6.6104      2004-09-27 16:37    "equipment fault"
"SouthEast"    2004-09-05 17:48    0.73387     3.6073      2004-09-05 20:46    "equipment fault"
"West"         2004-05-21 21:45     1.5999        NaN      2004-05-22 04:23    "equipment fault"
"SouthEast"    2002-09-01 18:22    0.95917     3.6759      2002-09-01 19:12    "severe storm"
"SouthEast"    2003-09-27 07:32        NaN     35.517      2003-10-04 07:02    "severe storm"
"West"         2003-11-12 06:12     2.5409     92.429      2003-11-17 02:04    "winter storm"
"NorthEast"    2004-09-18 05:54          0          0                   NaT    "equipment fault"
  ⋮
Assign Values to Rows
To assign one row to a table, you can use either a one-row table or a cell array. In this case, using a cell array can be more convenient than creating and assigning a one-row table.
For example, assign data to a new row at the end of outages. Display the end of the table.
outages(end+1,:) = {"East",datetime("now"),17.3,325,datetime("tomorrow"),"unknown"}; outages(end-2:end,:)
ans=3×6 table
Region OutageTime Loss Customers RestorationTime Cause
___________ ________________ ________ _________ ________________ _________________
"SouthEast"    2013-12-20 19:52    0.023096     0.10382     2013-12-20 23:29    "thunder storm"
"SouthEast"    2011-09-14 11:55     0.45042      1.1835     2011-09-14 13:28    "equipment fault"
"East"         2025-01-23 01:48        17.3         325     2025-01-24 00:00    "unknown"
To assign data to multiple rows, assign values from another table that has variables with the same names and data types. For example, create a new two-row table.
newOutages = table(["West";"North"], ... datetime(2024,1,1:2)', ... [3;4], ... [300;400], ... datetime(2024,1,3:4)',["unknown";"unknown"], ... VariableNames=outages.Properties.VariableNames)
newOutages=2×6 table
Region OutageTime Loss Customers RestorationTime Cause
_______ ___________ ____ _________ _______________ _________
"West"     01-Jan-2024     3         300         03-Jan-2024      "unknown"
"North"    02-Jan-2024     4         400         04-Jan-2024      "unknown"
Assign the two-row table to the first two rows of outages. Then display the first four rows of outages.
outages(1:2,:) = newOutages; outages(1:4,:)
ans=4×6 table
Region OutageTime Loss Customers RestorationTime Cause
___________ ________________ ______ _________ ________________ _________________
"West"         2024-01-01 00:00         3        300      2024-01-03 00:00    "unknown"
"North"        2024-01-02 00:00         4        400      2024-01-04 00:00    "unknown"
"SouthEast"    2003-02-07 21:15     2.894     14.294      2003-02-17 08:14    "winter storm"
"West"         2004-04-06 05:44    4.3481     34.037      2004-04-06 06:10    "equipment fault"
Assign Values to Elements
To assign values to elements of a table, use curly braces. For example, assign causes for the first two outages.
outages{1,"Cause"} = "severe storm"; outages{2,"Cause"} = "attack"; outages(1:4,:)
ans=4×6 table
Region OutageTime Loss Customers RestorationTime Cause
___________ ________________ ______ _________ ________________ _________________
"West"         2024-01-01 00:00         3        300      2024-01-03 00:00    "severe storm"
"North"        2024-01-02 00:00         4        400      2024-01-04 00:00    "attack"
"SouthEast"    2003-02-07 21:15     2.894     14.294      2003-02-17 08:14    "winter storm"
"West"         2004-04-06 05:44    4.3481     34.037      2004-04-06 06:10    "equipment fault"
Find Table Rows Where Values Meet Conditions
To find the rows of a table where values meet conditions, use logical indexing. Specify the table variables that have values of interest and create an array of row indices where values in those variables meet conditions that you specify. Index into the table using the row indices.
First, import power outage data from a spreadsheet into a table.
outages = readtable("outages.csv",TextType="string")
outages=1468×6 table
Region OutageTime Loss Customers RestorationTime Cause
___________ ________________ ______ __________ ________________ _________________
"SouthWest"    2002-02-01 12:18    458.98    1.8202e+06    2002-02-07 16:50    "winter storm"
"SouthEast"    2003-01-23 00:49    530.14    2.1204e+05                 NaT    "winter storm"
"SouthEast"    2003-02-07 21:15     289.4    1.4294e+05    2003-02-17 08:14    "winter storm"
"West"         2004-04-06 05:44    434.81    3.4037e+05    2004-04-06 06:10    "equipment fault"
"MidWest"      2002-03-16 06:18    186.44    2.1275e+05    2002-03-18 23:23    "severe storm"
"West"         2003-06-18 02:49         0             0    2003-06-18 10:54    "attack"
"West"         2004-06-20 14:39    231.29           NaN    2004-06-20 19:16    "equipment fault"
"West"         2002-06-06 19:28    311.86           NaN    2002-06-07 00:51    "equipment fault"
"NorthEast"    2003-07-16 16:23    239.93         49434    2003-07-17 01:12    "fire"
"MidWest"      2004-09-27 11:09    286.72         66104    2004-09-27 16:37    "equipment fault"
"SouthEast"    2004-09-05 17:48    73.387         36073    2004-09-05 20:46    "equipment fault"
"West"         2004-05-21 21:45    159.99           NaN    2004-05-22 04:23    "equipment fault"
"SouthEast"    2002-09-01 18:22    95.917         36759    2002-09-01 19:12    "severe storm"
"SouthEast"    2003-09-27 07:32       NaN    3.5517e+05    2003-10-04 07:02    "severe storm"
"West"         2003-11-12 06:12    254.09    9.2429e+05    2003-11-17 02:04    "winter storm"
"NorthEast"    2004-09-18 05:54         0             0                 NaT    "equipment fault"
  ⋮
Next, create row indices that match the rows where a variable meets a condition. For example, create indices for rows where the region is West.
rows = matches(outages.Region,"West")
rows = 1468x1 logical array
0 0 0 1 0 1 1 1 0 0 ⋮
You can index into a table with logical indices. Display the rows of the table for the outages that occur in the West region.
ans=354×6 table
Region OutageTime Loss Customers RestorationTime Cause
______ ________________ ______ __________ ________________ _________________
"West"    2004-04-06 05:44    434.81    3.4037e+05    2004-04-06 06:10    "equipment fault"
"West"    2003-06-18 02:49         0             0    2003-06-18 10:54    "attack"
"West"    2004-06-20 14:39    231.29           NaN    2004-06-20 19:16    "equipment fault"
"West"    2002-06-06 19:28    311.86           NaN    2002-06-07 00:51    "equipment fault"
"West"    2004-05-21 21:45    159.99           NaN    2004-05-22 04:23    "equipment fault"
"West"    2003-11-12 06:12    254.09    9.2429e+05    2003-11-17 02:04    "winter storm"
"West"    2004-12-21 18:50    112.05     7.985e+05    2004-12-29 03:46    "winter storm"
"West"    2002-12-16 13:43    70.752    4.8193e+05    2002-12-19 09:38    "winter storm"
"West"    2005-06-29 08:37    601.13         32005    2005-06-29 08:57    "equipment fault"
"West"    2003-04-14 07:11    276.41        1.5647    2003-04-14 08:52    "equipment fault"
"West"    2003-10-21 17:25    235.12         51496    2003-10-21 19:43    "equipment fault"
"West"    2005-10-21 08:33       NaN         52639    2005-11-22 22:10    "fire"
"West"    2003-08-28 23:46    172.01    1.6964e+05    2003-09-03 02:10    "wind"
"West"    2005-03-01 14:39    115.47         82611    2005-03-03 05:58    "equipment fault"
"West"    2005-09-26 06:32    258.18    1.3996e+05    2005-09-26 06:33    "earthquake"
"West"    2003-12-22 03:40    232.26    3.9462e+05    2003-12-24 16:32    "winter storm"
  ⋮
You can match multiple conditions with one logical expression. For example, find the rows where outages affected more than one million customers in the West or MidWest regions.
rows = (outages.Customers > 1e6 & (matches(outages.Region,"West") | matches(outages.Region,"MidWest"))); outages(rows,:)
ans=10×6 table
Region OutageTime Loss Customers RestorationTime Cause
_________ ________________ ______ __________ ________________ _________________
"MidWest"    2002-12-10 10:45     14493    3.0879e+06    2002-12-11 18:06    "unknown"
"West"       2007-10-20 20:56    3537.5    1.3637e+06    2007-10-20 22:08    "equipment fault"
"West"       2006-12-28 14:04    804.05    1.5486e+06    2007-01-04 14:26    "severe storm"
"MidWest"    2006-07-16 00:05    1817.9     3.295e+06    2006-07-27 14:42    "severe storm"
"West"       2006-01-01 11:54    734.11      4.26e+06    2006-01-11 01:21    "winter storm"
"MidWest"    2008-09-19 23:31    4801.1    1.2151e+06    2008-10-03 14:04    "severe storm"
"MidWest"    2008-09-07 23:35       NaN     3.972e+06    2008-09-19 17:19    "severe storm"
"West"       2011-07-24 02:54    483.37    1.1212e+06    2011-07-24 12:18    "wind"
"West"       2010-01-24 18:47    348.91    1.8865e+06    2010-01-30 01:43    "severe storm"
"West"       2010-05-17 09:10    8496.6    2.0768e+06    2010-05-18 22:43    "equipment fault"
Summary of Table Indexing Syntaxes
This table lists every table indexing syntax with every type of index and the resulting outputs. You can specify rows and variables by position, name, or data type.
- Linear indexing is not supported. When you index with curly braces or parentheses, you must specify both rows and variables.
- Variable names and row names can include any characters, including spaces and non-ASCII characters. Also, they can start with any character, not just letters. Variable and row names do not have to be valid MATLAB identifiers (as determined by the
isvarnamefunction). - When you specify rows or variables by name, you can use a pattern object to specify names. For example,
"Var" + digitsPatternmatches all names that start withVarand end with any number of digits. (since R2022a)
| Output | Syntax | Rows | Variables | Examples |
|---|---|---|---|---|
| Array, with data extracted from one variable | T._var_T.(expression) | Not specified | Specified as: A variable name (without quotation marks)An expression inside parentheses that returns a variable name or number | T.DateArray extracted from table variable named Date T.("2019-06-30")Array extracted from table variable named2019-06-30T.(1)Array extracted from the first table variable |
| Array, with specified elements of data extracted from one variable | T.var(i,j,...)T.(expression)(i,j,...) | Not specifiedThe indices_i_,j,... do not specify rows of the table, but rather elements of the extracted array. | Specified as: A variable name (without quotation marks)An expression inside parentheses that returns a variable name or number | Specify array elements using numeric or logical indices.If the extracted array is a matrix or multidimensional array, you can specify multiple numeric indices. T.Date(1:5)First five elements of array extracted from table variable namedDate T.("2019-06-30")(1:5)First five elements of array extracted from table variable named2019-06-30T.(1)(1:5)First five elements of array extracted from the first table variableT.Var1(1:5,1:3)First five rows and first three columns of matrix or multidimensional array extracted from table variable named Var1 |
| Array, with data concatenated from specified rows and variables | T{rows,vars} | Specified as: Row numbers (between 1 andm)Logical array that has m elementsNames, if T has row namesTimes, if T is a timetableColon (:), meaning all rowsend keyword, meaning last row | Specified as: Variable numbers (between 1 andn)Logical array that has n elementsNamesColon (:), meaning all variablesend keyword, meaning last variable | T{1:5,[1 4 5]}Array concatenated from the first five rows and the first, fourth, and fifth variables of TT{1:5,[true false false true true]}Array concatenated from the first five rows and the first, fourth, and fifth variables of TT{:,["A","B"]}Array concatenated from all rows and the variables namedA and BT{:,"A" + wildcardPattern}Array concatenated from all rows and the variables whose names start with A |
| Array, with data concatenated from specified rows and variables that have a specified data type | S = vartype(type);T{rows,S} | Specified as: Row numbers (between 1 andm)Logical array that has m elementsNames, if T has row namesTimes, if T is a timetableColon (:), meaning all rowsend keyword, meaning last row | Specified as a data type subscript, such asvartype("numeric"),vartype("categorical"), orvartype("datetime") | S = vartype("numeric");T{1:5,S}Array concatenated from the first five rows and the numeric variables of T |
| Array, with data concatenated from all rows and variables | T.Variables | Not specified | Not specified | T.VariablesIdentical to array returned by T{:,:} |
| Table, with specified rows and variables | T(rows,vars) | Specified as: Row numbers (between 1 andm)Logical array that has m elementsNames, if T has row namesTimes, if T is a timetableColon (:), meaning all rowsend keyword, meaning last row | Specified as: Variable numbers (between 1 andn)Logical array that has n elementsNamesColon (:), meaning all variablesend keyword, meaning last variable | T(1:5,[1 4 5])Table that has the first five rows and the first, fourth, and fifth variables of TT(1:5,[true false false true true])Table that has the first five rows and the first, fourth, and fifth variables of TT(:,["A","B"])Table that has all rows and the variables named A and BT(:,"A" + wildcardPattern)Table that has all rows and the variables whose names start withA |
| Table, with specified rows and variables that have a specified data type | S = vartype(type);T(rows,S) | Specified as: Row numbers (between 1 andm)Logical array that has m elementsNames, if T has row namesTimes, if T is a timetableColon (:), meaning all rowsend keyword, meaning last row | Specified as a data type subscript, such asvartype("numeric"),vartype("categorical"), orvartype("datetime") | S = vartype("numeric");T(1:5,S)Table that has the first five rows and the numeric variables ofT |
See Also
table | readtable | vartype | matches