Collect Statement and Function Coverage Metrics for MATLAB Source Code - MATLAB & Simulink (original) (raw)
When you run tests, you can collect and access code coverage information for your MATLAB® source code by adding an instance of the matlab.unittest.plugins.CodeCoveragePlugin class to the test runner. In MATLAB, a plugin created using a matlab.unittest.plugins.codecoverage.CoverageResult or matlab.unittest.plugins.codecoverage.CoverageReport format object provides information about statement and function coverage. For more information about statement and function coverage, see Types of Code Coverage for MATLAB Source Code.
This example shows how to collect code coverage metrics and generate reports including statement and function coverage information for source code in a file. The file defines the QuadraticPolynomial class, which represents quadratic polynomials. The class constructor first validates that the coefficients of the polynomial are numeric values and then uses these values to initialize the class properties. The class includes the solve method to return the roots of the specified quadratic polynomial and the plot method to plot the polynomial around its axis of symmetry. To view the complete code for QuadraticPolynomial, see QuadraticPolynomial Class Definition.
Collect and Analyze Code Coverage Information
In your current folder, save the QuadraticPolynomial class definition in a file named QuadraticPolynomial.m. Then, create the QuadraticPolynomialTest1 test class in your current folder. The two Test methods in the class test the solve method against real and imaginary solutions.
classdef QuadraticPolynomialTest1 < matlab.unittest.TestCase methods (Test) function realSolution(testCase) p = QuadraticPolynomial(1,-3,2); actSolution = p.solve(); expSolution = [1 2]; testCase.verifyEqual(actSolution,expSolution) end function imaginarySolution(testCase) p = QuadraticPolynomial(1,2,10); actSolution = p.solve(); expSolution = [-1-3i -1+3i]; testCase.verifyEqual(actSolution,expSolution) end end end
To run tests and perform a code coverage analysis, first create a test runner with a plugin that provides programmatic access to the statement and function coverage information for source code in the file QuadraticPolynomial.m.
import matlab.unittest.plugins.CodeCoveragePlugin import matlab.unittest.plugins.codecoverage.CoverageResult
runner = testrunner("textoutput"); format = CoverageResult; plugin = CodeCoveragePlugin.forFile("QuadraticPolynomial.m",Producing=format); addPlugin(runner,plugin)
Create a test suite from the QuadraticPolynomialTest1 class and run the tests. The tests pass.
suite1 = testsuite("QuadraticPolynomialTest1"); run(runner,suite1);
Running QuadraticPolynomialTest1 .. Done QuadraticPolynomialTest1
After the test run, the Result property of the CoverageResult object holds the coverage result. Access the statement coverage summary from the coverage result. The returned vector indicates that the tests executed 8 out of the 17 statements in the file, resulting in 47% statement coverage. The statement coverage is low because the tests did not execute the code that throws an error and the code within the plot method.
result1 = format.Result; statementSummary = coverageSummary(result1,"statement")
statementSummary = 1×2
8 17Access the function coverage summary. The summary indicates that the function coverage is 75% because the tests missed one of the four methods in the QuadraticPolynomial class (plot).
functionSummary = coverageSummary(result1,"function")
functionSummary = 1×2
3 4Use the additional output argument of the coverageSummary method to retrieve the execution count for each method.
[~,functionDescription] = coverageSummary(result1,"function")
functionDescription = struct with fields: NumJustified: 0 function: [1×4 struct]
disp([functionDescription.function.ExecutionCount])
Generate Code Coverage Report
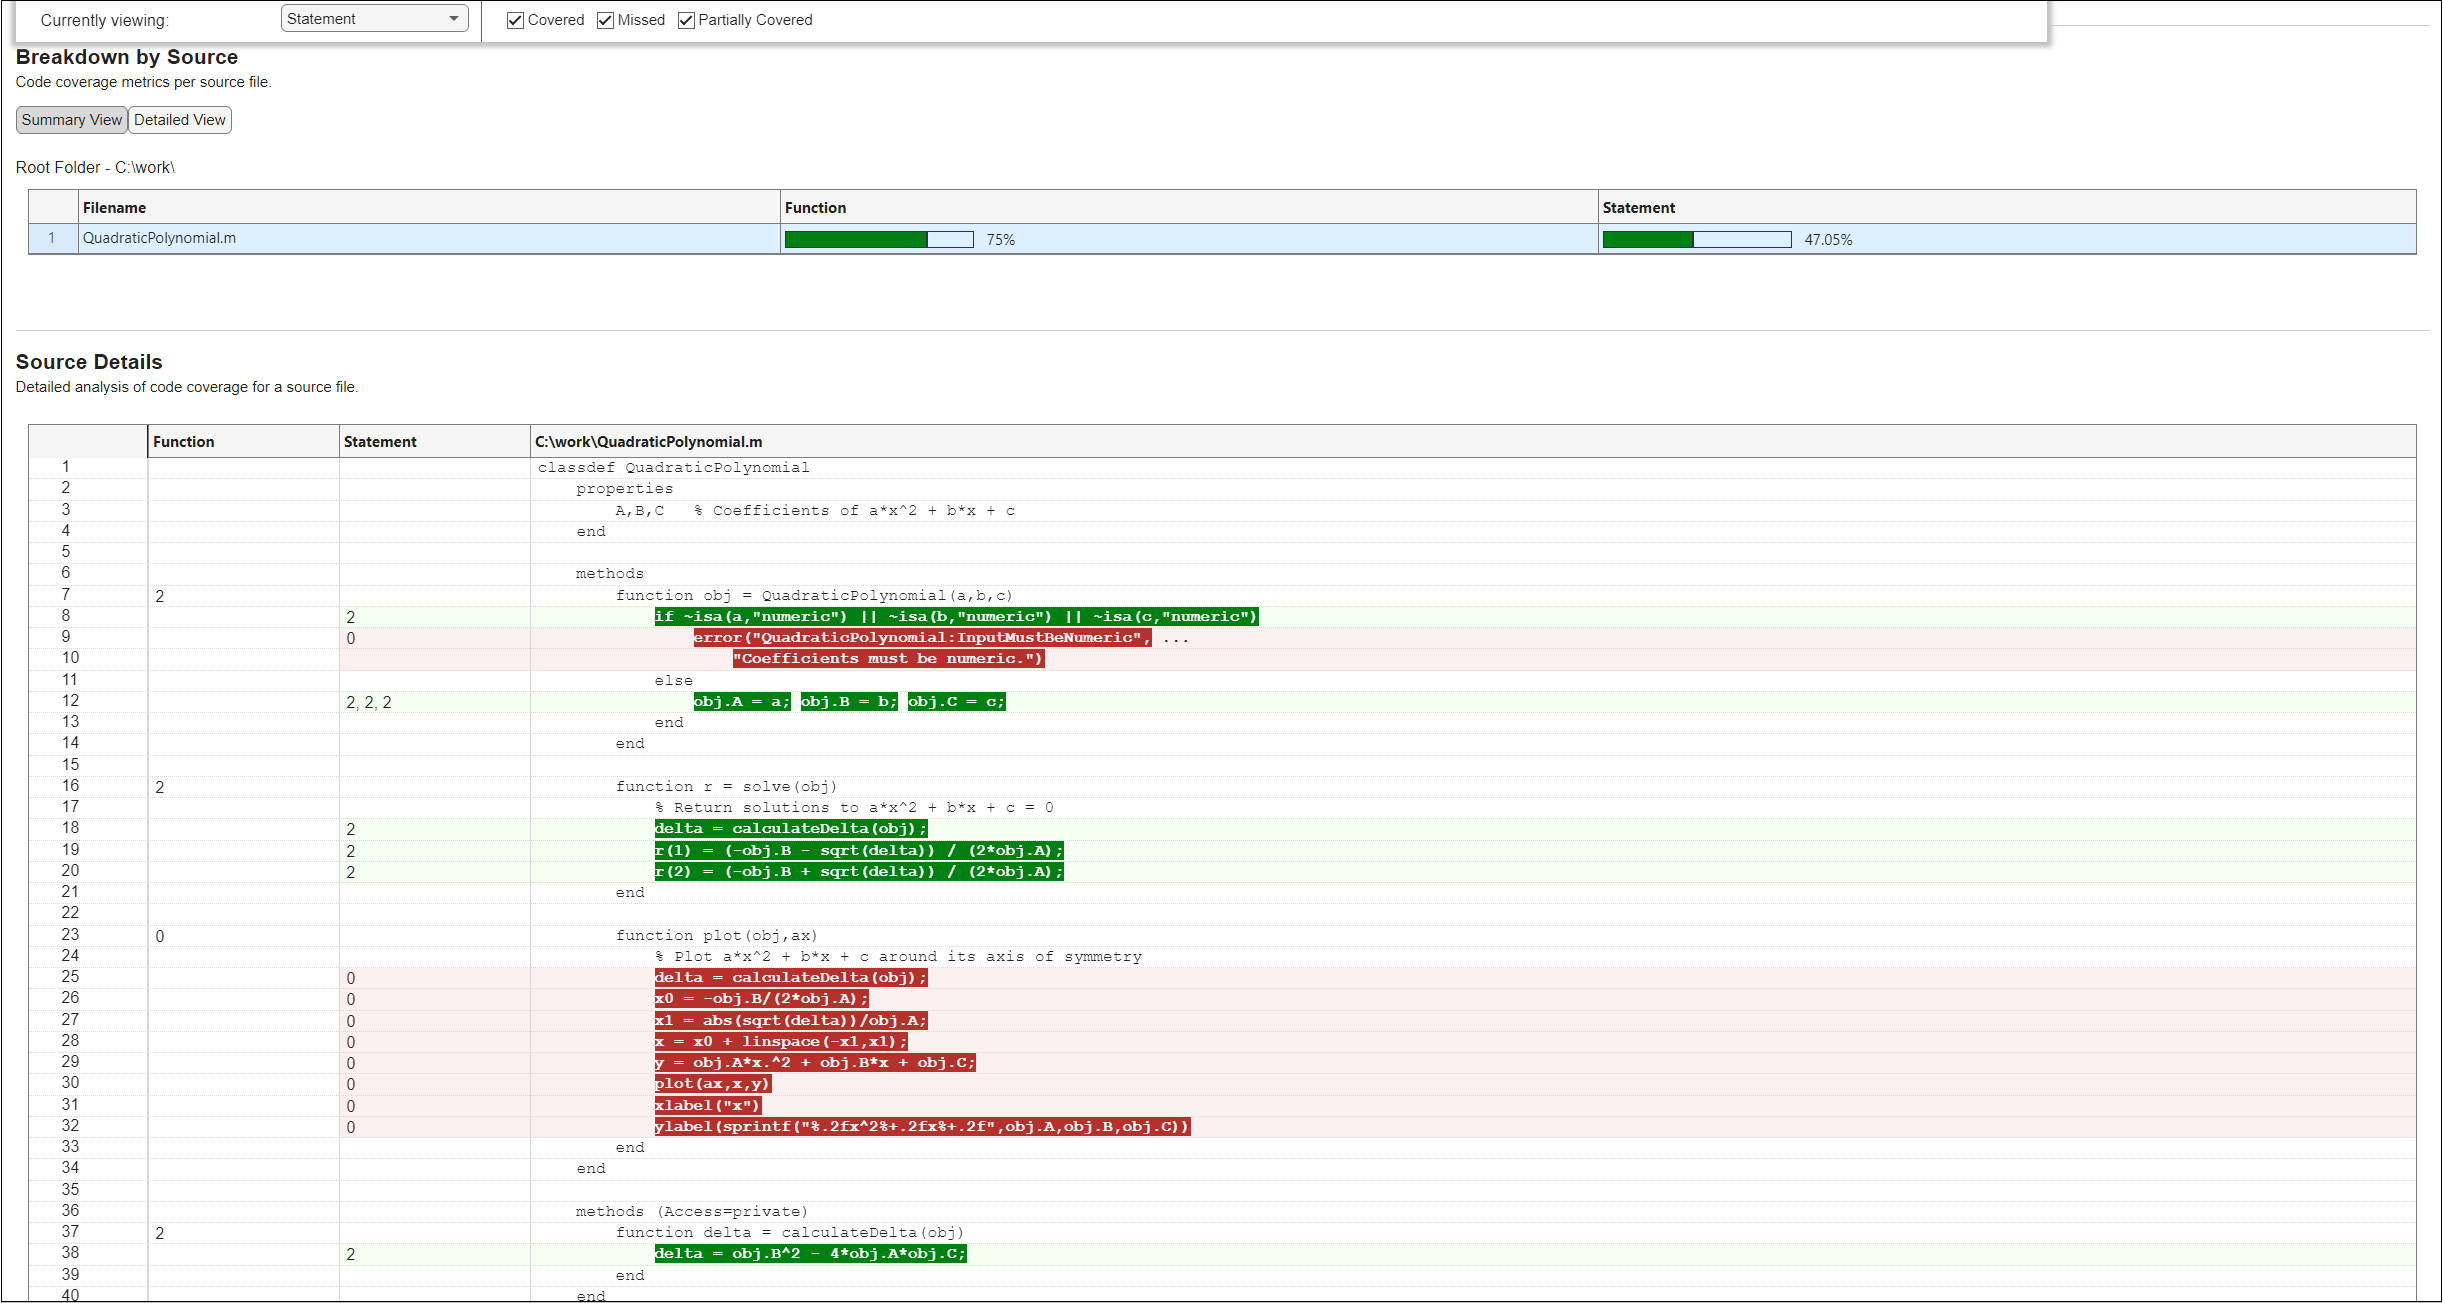
Now, generate an interactive HTML code coverage report from the coverage result. The report displays information about statement and function coverage and uses different colors to highlight the executed or missed statements and functions.
generateHTMLReport(result1)
You can interact with the HTML code coverage report. For example, you can select a coverage type from the Currently viewing list to view detailed information about that coverage type, and you can control the highlighting for covered or missed executables. This figure shows the Source Details section for statement coverage, which displays all the statements that were covered or missed.
Run Additional Tests to Improve Coverage
Create tests to execute the parts of the source code that were not executed by suite1. In your current folder, create another test class named QuadraticPolynomialTest2. One Test method in the class tests against nonnumeric inputs, and the other Test method tests properties of a plotted polynomial.
classdef QuadraticPolynomialTest2 < matlab.unittest.TestCase methods (Test) function nonnumericInput(testCase) testCase.verifyError(@()QuadraticPolynomial(1,"-3",2), ... "QuadraticPolynomial:InputMustBeNumeric") end function plotPolynomial(testCase) p = QuadraticPolynomial(1,-3,2); fig = figure; testCase.addTeardown(@close,fig) ax = axes(fig); p.plot(ax) actYLabelText = ax.YLabel.String; expYLabelText = '1.00x^2-3.00x+2.00'; testCase.verifyEqual(actYLabelText,expYLabelText) end end end
Create a test suite from the QuadraticPolynomialTest2 class and run the tests. The tests pass.
suite2 = testsuite("QuadraticPolynomialTest2"); run(runner,suite2);
Running QuadraticPolynomialTest2 .
. Done QuadraticPolynomialTest2
In this example, you ran different test suites to qualify the same source code. To report on the total aggregated coverage for these test runs, generate an interactive HTML report from the union of the coverage results corresponding to the test runs. The report shows that the two test suites combined fully exercised the statements and functions in the source code.
result2 = format.Result; generateHTMLReport(result1 + result2)
QuadraticPolynomial Class Definition
This code provides the complete contents of the QuadraticPolynomial class.
classdef QuadraticPolynomial properties A,B,C % Coefficients of ax^2 + bx + c end
methods
    function obj = QuadraticPolynomial(a,b,c)
        if ~isa(a,"numeric") || ~isa(b,"numeric") || ~isa(c,"numeric")
            error("QuadraticPolynomial:InputMustBeNumeric", ...
                "Coefficients must be numeric.")
        else
            obj.A = a; obj.B = b; obj.C = c;
        end
    end

    function r = solve(obj)
        % Return solutions to a*x^2 + b*x + c = 0
        delta = calculateDelta(obj);
        r(1) = (-obj.B - sqrt(delta)) / (2*obj.A);
        r(2) = (-obj.B + sqrt(delta)) / (2*obj.A);
    end

    function plot(obj,ax)
        % Plot a*x^2 + b*x + c around its axis of symmetry
        delta = calculateDelta(obj);
        x0 = -obj.B/(2*obj.A);
        x1 = abs(sqrt(delta))/obj.A;
        x = x0 + linspace(-x1,x1);
        y = obj.A*x.^2 + obj.B*x + obj.C;
        plot(ax,x,y)
        xlabel("x")
        ylabel(sprintf("%.2fx^2%+.2fx%+.2f",obj.A,obj.B,obj.C))
    end
end

methods (Access=private)
    function delta = calculateDelta(obj)
        delta = obj.B^2 - 4*obj.A*obj.C;
    end
end
end
See Also
Classes
- matlab.unittest.plugins.CodeCoveragePlugin | matlab.coverage.Result | matlab.unittest.plugins.codecoverage.CoverageResult | matlab.unittest.plugins.codecoverage.CoverageReport | matlab.unittest.plugins.codecoverage.CoberturaFormat