daspect - Control data unit length along each axis - MATLAB (original) (raw)
Control data unit length along each axis
Syntax
Description
daspect([ratio](#f20-707492-ratio)) sets the data aspect ratio for the current axes. The data aspect ratio is the relative length of the data units along the _x_-axis, _y_-axis, and _z_-axis. Specify ratio as a three-element vector of positive values that represent the relative lengths of data units along each axis. For example, [1 2 3] indicates that the length from 0 to 1 along the _x_-axis is equal to the length from 0 to 2 along the _y_-axis and 0 to 3 along the _z_-axis. For equal data unit lengths in all directions, use [1 1 1].
[d](#f20-707492-d) = daspect returns the data aspect ratio for the current axes.
daspect auto sets an automatic mode, enabling the axes to choose the data aspect ratio. The mode must be automatic to enable the “stretch-to-fill” feature of the axes.
daspect manual sets a manual mode and uses the ratio stored in theDataAspectRatio property for the Axes object. When the mode is manual, it disables the stretch-to-fill behavior of the axes. Specifying a value for the data aspect ratio sets the mode to manual.
[m](#f20-707492-m) = daspect(`'mode'`) returns the current mode, which is either 'auto' or 'manual'. By default, the mode is automatic unless you specify the data aspect ratio or set the mode to manual.
___ = daspect([ax](#f20-707492-ax),___) uses the axes specified by ax instead of the current axes. Specify the axes as the first input argument for any of the previous syntaxes. Use single quotes around the 'auto' and 'manual' inputs.
Examples
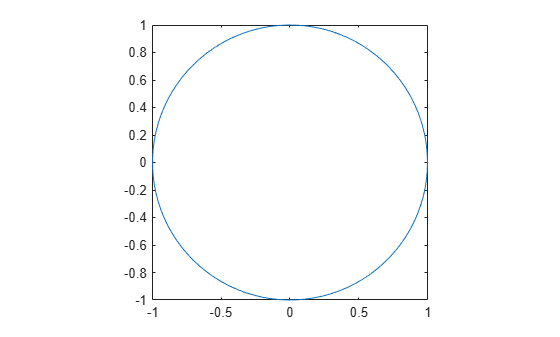
Use Equal Data Unit Lengths Along Each Axis
Plot a set of data. Use data units of equal lengths in all directions by setting the data aspect ratio to [1 1 1].
t = linspace(0,2*pi); x = cos(t); y = sin(t); plot(x,y) daspect([1 1 1])
Use Different Data Unit Lengths Along Each Axis
Plot a set of data. Set the data aspect ratio so that the length of one data unit in the _x_-axis direction equals the length of two data units in the _y_-axis direction and _z_-axis direction (not shown).
t = linspace(0,2*pi); x = cos(t); y = sin(t); plot(x,y) daspect([1 2 2])
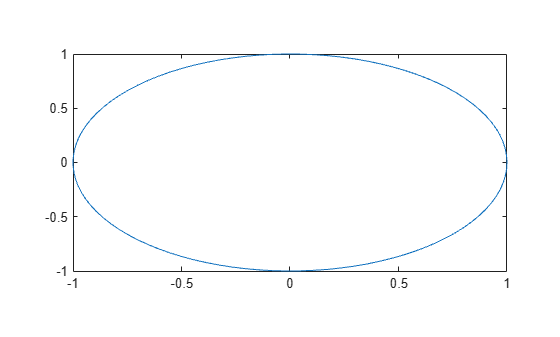
When you set the data aspect ratio, the associated mode changes to manual. Query the current data aspect ratio mode.
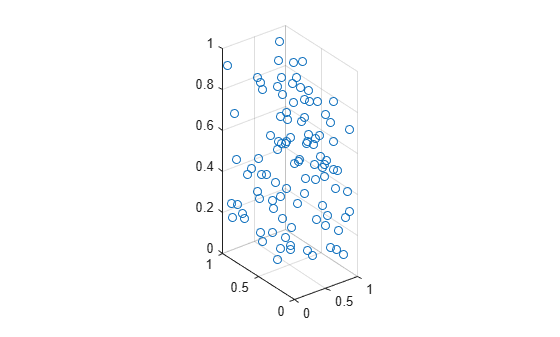
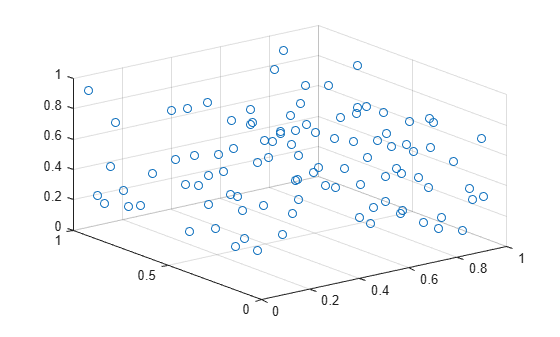
Revert Back to Default Data Aspect Ratio
Create a 3-D scatter chart of random data and set the data aspect ratio. Then revert back to the default data aspect ratio.
X = rand(100,1); Y = rand(100,1); Z = rand(100,1); scatter3(X,Y,Z) daspect([3 2 1])
Query Data Aspect Ratio
Create a surface plot and query the data aspect ratio.
[x,y] = meshgrid(-2:.2:2); z = x.*exp(-x.^2 - y.^2); surf(x,y,z)
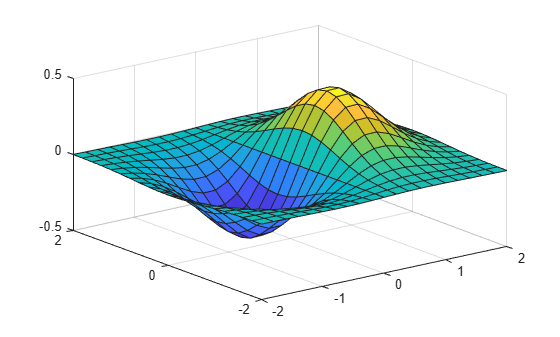
The ratio indicates that the length of four units in the _x_-axis direction equals four units in the _y_-axis direction and one unit in the _z_-axis direction. For example, if the ratio is [4 4 1], then the length from 0 to 1 on the _x_-axis equals the length from 0 to 1 on the _y_-axis and 0 to 0.25 on the _z_-axis.
Set Data Aspect Ratio for Specific Axes Object
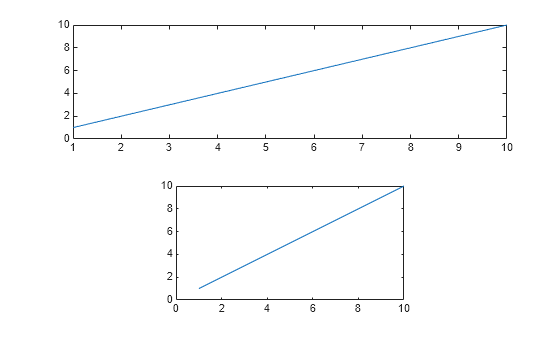
Create a 2-by-1 tiled chart layout containing the axes ax1 and ax2. Plot into the axes, and set the data aspect ratio for the lower plot by specifying ax2 as the first input argument to the daspect function.
tiledlayout(2,1) ax1 = nexttile; plot(ax1,1:10)
ax2 = nexttile; plot(ax2,1:10) daspect(ax2,[1 2 1])
Input Arguments
ratio — Data aspect ratio
three-element vector
Data aspect ratio, specified as a three-element vector of positive values. For example, daspect([1 2 3]) specifies that the length of one unit along the _x_-axis equals the length of two units along the _y_-axis and three units along the _z_-axis.
Specifying the data aspect ratio sets the DataAspectRatio property for the Axes object. The DataAspectRatio property interacts with the PlotBoxAspectRatio, XLim, YLim, and ZLim properties to control the length and scale of the _x_-axis, _y_-axis, and _z_-axis.
Specifying the ratio sets the DataAspectRatioMode property to 'manual' and disables the stretch-to-fill behavior of the axes.
Data Types: single | double | int8 | int16 | int32 | int64 | uint8 | uint16 | uint32 | uint64
ax — Target axes
Axes object
Target axes, specified as an Axes object. If you do not specify the axes, then daspect uses the current axes (gca).
Output Arguments
d — Current data aspect ratio values
three-element vector
Current data aspect ratio, returned as a three-element vector of values representing the ratio of the _x_-axis, _y_-axis, and z data unit lengths.
Querying the data aspect ratio returns the DataAspectRatio property value for the corresponding Axes object.
m — Current data aspect ratio mode
'auto' | 'manual'
Current data aspect ratio mode, returned as either 'auto' or 'manual'. When the mode is automatic, MATLAB® determines the appropriate data aspect ratio value. If you specify a value, then the mode changes to manual.
Querying the data aspect ratio mode returns the DataAspectRatioMode property value for the corresponding Axes object.
More About
Stretch-to-Fill
When the “stretch-to-fill” behavior is enabled, MATLAB stretches the axes to fill the available space. The axes might not exactly match the data aspect ratio, plot box aspect ratio, and camera-view angle values stored in its DataAspectRatio, PlotBoxAspectRatio, and CameraViewAngle properties.
If you specify the data aspect ratio, plot box aspect ratio, or camera-view angle, then the “stretch-to-fill” behavior is disabled. When the behavior is disabled, MATLAB makes the axes as large as possible within the available space and strictly adheres to the property values. There is no distortion. For more information, see Control Axes Layout.
Algorithms
The daspect function sets and queries several axes properties related to the data aspect ratio.
- DataAspectRatio — Property that stores the data aspect ratio value.
- DataAspectRatioMode — Property that stores the data aspect ratio mode. When you set the ratio, this property changes to
'manual'.
Version History
Introduced before R2006a