findobj - Find graphics objects with specific properties - MATLAB (original) (raw)
Find graphics objects with specific properties
Syntax
Description
h = findobj returns the graphics root object and all of its descendants.
h = findobj([prop](#mw%5F0c1f3244-7c07-4392-ba2f-f1f476ca93b9),[value](#mw%5Fd921c528-bda6-48c7-b27c-0ad9686360b8)) returns all objects in the hierarchy that have their property prop set tovalue.
h = findobj('-not',[prop](#mw%5F0c1f3244-7c07-4392-ba2f-f1f476ca93b9),[value](#mw%5Fd921c528-bda6-48c7-b27c-0ad9686360b8)) returns all objects whose specified property is not set to the specified value.
h = findobj([prop](#mw%5F0c1f3244-7c07-4392-ba2f-f1f476ca93b9)1,[value](#mw%5Fd921c528-bda6-48c7-b27c-0ad9686360b8)1,[oper](#mw%5Fc565ac60-74c0-4a9e-b6b6-ff5f2482a407),[prop](#mw%5F0c1f3244-7c07-4392-ba2f-f1f476ca93b9)2,[value](#mw%5Fd921c528-bda6-48c7-b27c-0ad9686360b8)2) applies the logical operator oper to the prop,value pairs. For example, h = findobj('LineStyle','--','-and','Marker','o') returns all objects that have a dashed line style and circular markers.
h = findobj('-regexp',[prop](#mw%5F0c1f3244-7c07-4392-ba2f-f1f476ca93b9),[expr](#mw%5F61301e1f-a31e-4eaf-870f-42a9c0bc8a75)) uses a regular expression to find objects with specific property values. Objects with property values satisfying the regular expression are returned.
h = findobj('-property',[prop](#mw%5F0c1f3244-7c07-4392-ba2f-f1f476ca93b9)) returns all objects that have the specified property.
h = findobj([prop](#mw%5F0c1f3244-7c07-4392-ba2f-f1f476ca93b9)1,[value](#mw%5Fd921c528-bda6-48c7-b27c-0ad9686360b8)1,...,[prop](#mw%5F0c1f3244-7c07-4392-ba2f-f1f476ca93b9)N,[value](#mw%5Fd921c528-bda6-48c7-b27c-0ad9686360b8)N) returns all objects in the hierarchy that have the specified properties set to the specified values. You can replace prop,value pairs with other input argument combinations from the previous syntaxes. For example, h = findobj(prop1,value1,'-not',prop2,value2,'-property',prop3) returns all objects that satisfy these three conditions:
- The object has a property
prop1set tovalue1. - The object has a property
prop2whose value is not set tovalue2. - The object has a property
prop3.
h = findobj([objhandles](#mw%5F271ce9a4-3715-403a-bd03-bd539f497ffc),___) restricts the search to the objects listed in objhandles and all of their descendants. You can restrict the search for any of the previous syntaxes.
h = findobj([objhandles](#mw%5F271ce9a4-3715-403a-bd03-bd539f497ffc),'-depth',[d](#mw%5Fc4aecc01-5703-4ef6-946e-8d7ca347fe42),___) restricts the search to the objects listed in objhandles and their descendants that are up to d levels lower in the graphics object hierarchy.
h = findobj([objhandles](#mw%5F271ce9a4-3715-403a-bd03-bd539f497ffc),'flat',___) restricts the search to the objects listed only in objhandles. The descendant objects are not searched. Using the 'flat' option is the same as using the '-depth' option with d = 0.
Examples
Find All Graphics Objects
Delete all existing figures, and then create a plot of random values.
Return the graphics root object and all of its descendants.
h = 8x1 graphics array:
Root Figure (1) Axes Line Line Line Line Line
Find All Line Objects
Delete all existing figures, and then create a multiline plot.
Return all line objects.
h = findobj('Type','line')
h = 4x1 Line array:
Line Line Line Line
Find Objects with Specified Property Values
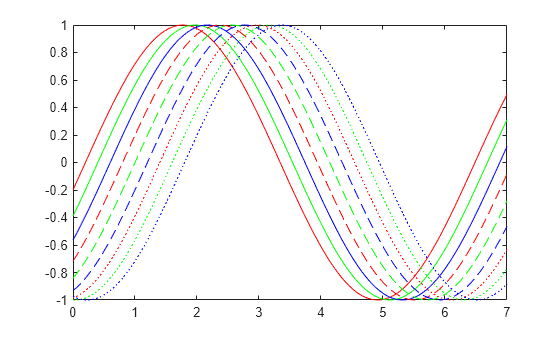
Plot nine sine waves with custom colors and line styles.
x = linspace(0,7); y = ones(length(x),9); for i = 1:9 y(:,i) = sin(x-i/5)'; end plot(x,y)
colororder({'red','green','blue'}) ax = gca; ax.LineStyleOrder = {'-','--',':'};
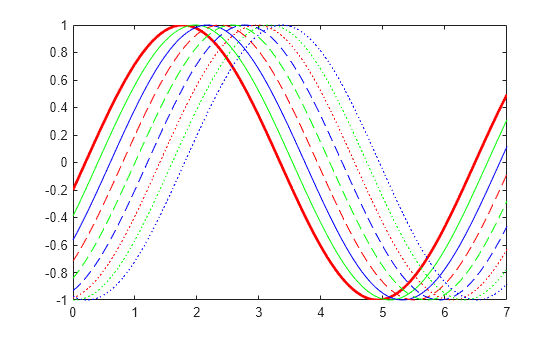
Return the solid red line. Then, change the thickness of the line.
h = findobj('Color','red','LineStyle','-')
h = Line with properties:
          Color: [1 0 0]
      LineStyle: '-'
      LineWidth: 0.5000
         Marker: 'none'
     MarkerSize: 6
MarkerFaceColor: 'none'
          XData: [0 0.0707 0.1414 0.2121 0.2828 0.3535 0.4242 0.4949 0.5657 0.6364 0.7071 0.7778 0.8485 0.9192 0.9899 1.0606 1.1313 1.2020 1.2727 1.3434 1.4141 1.4848 1.5556 1.6263 1.6970 1.7677 1.8384 1.9091 1.9798 2.0505 2.1212 ... ] (1x100 double)
          YData: [-0.1987 -0.1289 -0.0586 0.0121 0.0827 0.1529 0.2224 0.2907 0.3576 0.4226 0.4856 0.5462 0.6040 0.6588 0.7103 0.7582 0.8024 0.8426 0.8785 0.9101 0.9371 0.9594 0.9769 0.9896 0.9973 1.0000 0.9977 0.9905 0.9782 0.9611 ... ] (1x100 double)
Use GET to show all properties
Find Objects Using Logical Expressions
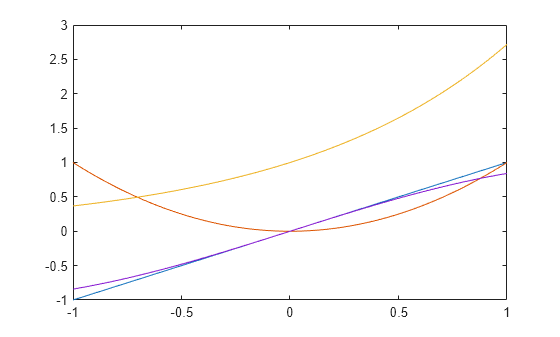
Create a multiline plot. Specify an identifier for each plot.
x = linspace(-1,1); y1 = x; plot(x,y1,'Tag','linear') hold on y2 = x.^2; plot(x,y2,'Tag','quadratic') y3 = exp(x); plot(x,y3,'Tag','exponential') y4 = sin(x); plot(x,y4,'Tag','sinusoidal') hold off
Find all objects whose Tag property is not set to 'linear'.
h1 = findobj('-not','Tag','linear')
h1 = 6x1 graphics array:
Root Figure (1) Axes Line (sinusoidal) Line (exponential) Line (quadratic)
Find all objects whose Tag property is not set to 'linear' or 'quadratic'.
h2 = findobj('-not',{'Tag','linear','-or','Tag','quadratic'})
h2 = 5x1 graphics array:
Root Figure (1) Axes Line (sinusoidal) Line (exponential)
Find all line objects whose Tag property is not set to 'linear' or 'quadratic'.
h3 = findobj('Type','line','-not',{'Tag','linear','-or','Tag','quadratic'})
h3 = 2x1 Line array:
Line (sinusoidal) Line (exponential)
Improve the readability of the previous statement by using '-and' and curly brackets.
h4 = findobj({'Type','line'},'-and',{'-not',{'Tag','linear','-or','Tag','quadratic'}})
h4 = 2x1 Line array:
Line (sinusoidal) Line (exponential)
Find Objects Using Regular Expression
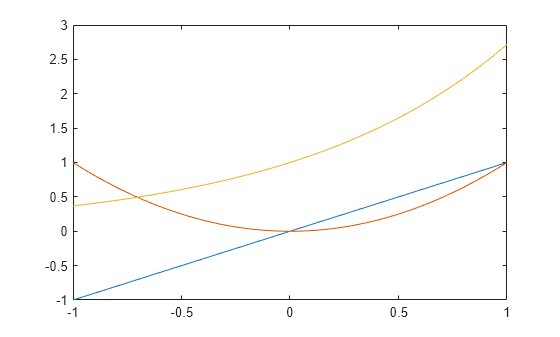
Create three line plots and assign an identifier to two of the plots.
x = linspace(-1,1); y1 = x; plot(x,y1) hold on y2 = x.^2; plot(x,y2,'Tag','Quadratic') y3 = exp(x); plot(x,y3,'Tag','Exponential') hold off
Find all objects that have a nonempty Tag property.
h = findobj('-regexp','Tag','[^'']')
h = 2x1 Line array:
Line (Exponential) Line (Quadratic)
Find All Objects with Specified Property
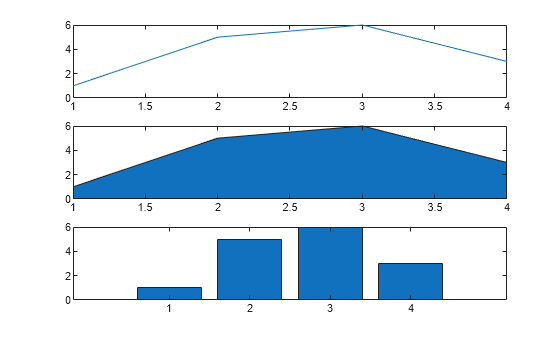
Create a vector of four values. Display the values using a line plot, an area plot, and a bar graph.
y = [1 5 6 3]; subplot(3,1,1) plot(y) subplot(3,1,2) area(y) subplot(3,1,3) bar(y)
Return all objects that have a BaseValue property.
h = findobj('-property','BaseValue')
h = 2x1 graphics array:
Bar Area
Find All Line Objects in Current Axes
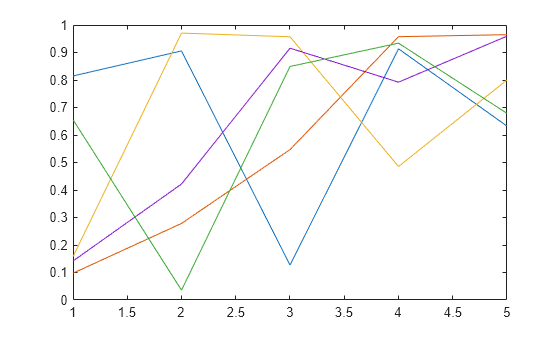
Create a plot of random values, and then return all line objects in the current axes.
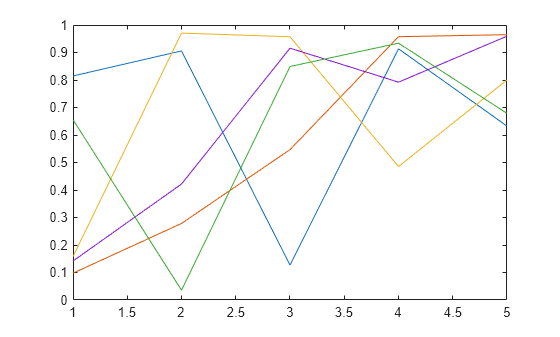
h = findobj(gca,'Type','line')
h = 5x1 Line array:
Line Line Line Line Line
Use h to query the y values of the first Line object.
values = 1×5
0.6557 0.0357 0.8491 0.9340 0.6787Find All Objects in Current Figure
Create a figure with two tabs. Add axes to each tab by specifying the parent container for each one. Plot a line in the first tab and a surface in the second tab.
figure tab1 = uitab('Title','Tab1'); ax1 = axes(tab1); plot(ax1,1:10)
tab2 = uitab('Title','Tab2'); ax2 = axes(tab2); surf(ax2,peaks)
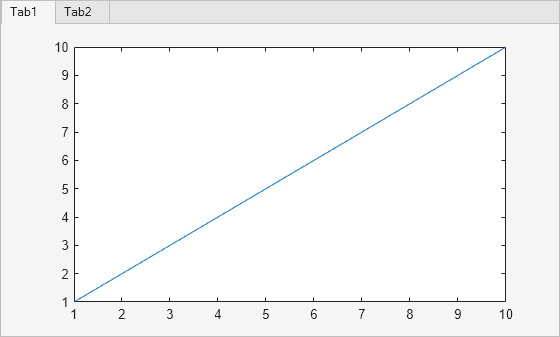
Return all objects in the current figure and its descendants.
h = 8x1 graphics array:
Figure (1) TabGroup Tab (Tab1) Tab (Tab2) Axes Axes Line Surface
Restrict Search Depth
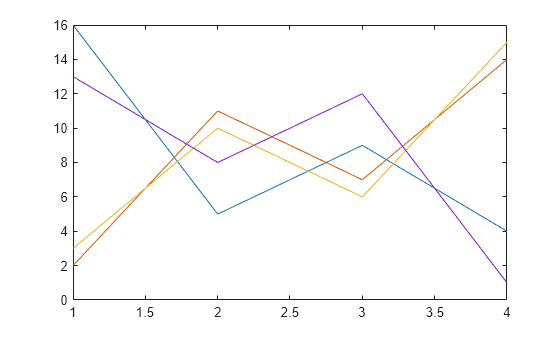
Create a figure with two stacked subplots.
subplot(2,1,1) x = linspace(0,10); y1 = sin(x); plot(x,y1)
subplot(2,1,2) y2 = sin(5*x); plot(x,y2)
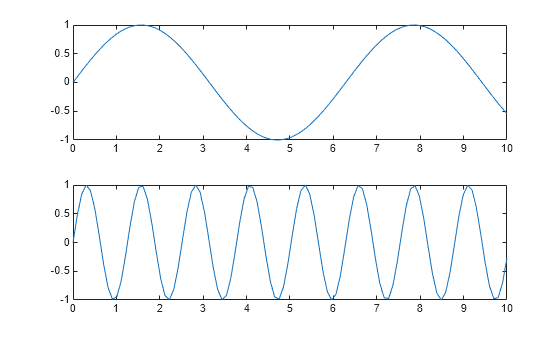
Find all objects in the current figure and its children.
h1 = findobj(gcf,'-depth',1)
h1 = 3x1 graphics array:
Figure (1) Axes Axes
Find all objects in the current figure and any descendants that are up to two levels lower in the graphics object hierarchy.
h2 = findobj(gcf,'-depth',2)
h2 = 5x1 graphics array:
Figure (1) Axes Axes Line Line
Restrict the search to the current figure and the current axes using the 'flat' option.
h3 = findobj([gcf,gca],'flat')
h3 = 2x1 graphics array:
Figure (1) Axes
Input Arguments
prop — Property name
character vector | string scalar
Property name, specified as a character vector or string scalar. For more information, see Graphics Object Properties.
Example: 'Tag'
Example: 'Type'
value — Property value
scalar | array
Property value, specified as a scalar or array.
oper — Logical operator
'-and' (default) | '-or' | '-xor'
Logical operator, specified as '-and', '-or', or '-xor'. Logical operator precedence follows MATLAB® precedence rules. For more information, see Operator Precedence.
To control operator precedence, groupprop,value pairs within cell arrays. For example, find all objects that have a Tag property set to'button one' and a Color property set to a value other than 'red' or'blue':
h = findobj('Tag','button one','-and', ... '-not',{'Color','red','-or','Color','blue'})
expr — Regular expression
string array | character vector | cell array of character vectors
Regular expression, specified as a string array, character vector, or cell array of character vectors. expr can contain characters, metacharacters, operators, tokens, and flags that specify patterns to match in the property value. You can use expr only when the property value is a string or character vector. For more information about regular expressions, see regexp.
objhandles — Objects to search from
array of graphics objects
Objects to search from, specified as an array of graphics objects. Unless you specify the '-depth' or 'flat' options,findobj searches the objects in the input arrayobjhandles and all of their descendants in the graphics object hierarchy.
d — Depth of search
nonnegative integer
Depth of search, specified as a nonnegative integer indicating the number of levels below any given object in the input array objhandles.
d = n— Searchnlevels of the hierarchy below each object inobjhandles.d = 0— Search only the same level as the objects inobjhandles. This is equivalent to specifying the'flat'option.d = inf— Search all levels below the objects inobjhandles. This is equivalent to a default search without specifying the'-depth'or'flat'options.
Tips
- If the
HandleVisibilityproperty of an object is set to'off',findobjdoes not return that graphics object or any of its descendants. To return all objects in the hierarchy, including hidden objects, use the findall function. findobjcorrectly matches any legal property value. For example, this code finds all objects having aColorproperty set tored,r, or[1 0 0]:- When a graphics object is a descendant of more than one object identified inobjhandles, MATLAB searches the object each time
findobjencounters its handle. Therefore, implicit references to a graphics object can result in multiple returns of the object.
Version History
Introduced before R2006a