DataTipTextRow - Add row to data tips - MATLAB (original) (raw)
Description
Use the dataTipTextRow function to create a new data tip row with a particular label, value source, and value format. After you create the new data tip row, you must attach it to the DataTipTemplate property of the plotted object.
Creation
Syntax
Description
r = dataTipTextRow([label](matlab.graphics.datatip.datatiptextrow.html#mw%5Fc7f9401b-e063-442c-b7ab-2d2b9eb0d4d5),[value](matlab.graphics.datatip.datatiptextrow.html#mw%5F529fa486-cb33-4e4d-a131-01d5f20a4d6b)) creates a new data tip row that uses the specified label and value source.
r = dataTipTextRow([label](matlab.graphics.datatip.datatiptextrow.html#mw%5Fc7f9401b-e063-442c-b7ab-2d2b9eb0d4d5),[value](matlab.graphics.datatip.datatiptextrow.html#mw%5F529fa486-cb33-4e4d-a131-01d5f20a4d6b),[format](matlab.graphics.datatip.datatiptextrow.html#mw%5F7232f280-5460-4d9d-92ab-2278c44ab58d)) additionally specifies the format for the displayed values.
Properties
Label — Label
character vector | string scalar
Label, specified as a character vector or string scalar.
Example: 'My Label'
Value — Value source
character vector | string scalar | vector | function handle
Value source, specified as a character vector or string scalar containing the name of a data property (such as 'XData'), the name of a workspace or table variable, a vector, or a function handle. The number of source values must match the number of data points.
Example: 'XData' specifies the value source as theXData property of the plotted object.
Example: [1 2 3 4 5] specifies the value source as a vector.
Example: @(x)sin(x) specifies a function handle wherex is the XData values of the object.
Example: @(x,y)sin(y) specifies a function handle wherey is the YData values of the object.
Format — Value format
'auto' (default) | character vector | string scalar
Value format, specified as 'auto' or a character vector or string scalar with a numeric, datetime, or duration format. The type of format that you specify must match the type of values in the Value property.
Example: r = dataTipTextRow(label,value,'usd') specifies a predefined numeric format for U.S. dollars.
Example: r = dataTipTextRow(label,value,'%#4.4g') specifies a numeric format.
Example: r = dataTipTextRow(label,value,'yyyy-MM-dd') specifies a datetime format.
Example: r = dataTipTextRow(label,value,'hh:mm:ss') specifies a duration format.
Numeric Formats
You can specify one of the predefined formats listed in this table. Alternatively, you can specify a custom numeric format.
| Predefined Format | Description |
|---|---|
| 'usd' | U.S. dollars. This option is equivalent using'$%,.2f'. If the labels use scientific notation, this option sets the exponent value to 0. |
| 'eur' | Euro. This option is equivalent to using'\x20AC%,.2f' with an exponent value of 0. |
| 'gbp' | British pound. This option is equivalent to using'\x00A3%,.2f' with an exponent value of 0. |
| 'jpy' | Japanese yen. This option is equivalent to using'\x00A5%,d' with an exponent value of 0. |
| 'degrees' | Display degree symbol after values. This option is equivalent to using '%g\x00B0' with the default exponent value. |
| 'percentage' | Display percent sign after values. This option is equivalent to using '%g%%' with the default exponent value. |
| 'auto' | Default format of '%g' with the default exponent value. |
If none of the formats mentioned in the table gives the format you want, then create a custom character vector or string with identifiers.
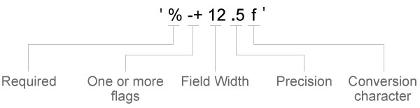
Identifiers are optional, except the percent sign and conversion character. Construct the format in this order:
- Percent sign
- One or more flags — Options such as adding a plus sign before positive values. For a full list of options, see the table of optional flags.
- Field width — Minimum number of characters to print in the tick label. Specify the field width as an integer value. If the number of significant digits in the tick value is smaller than the field width, then the label is padded with spaces.
- Precision — Number of digits to the right of the decimal point or the number of significant digits, depending on the conversion character. Specify the precision as an integer value.
- Conversion character — Value type. For a full list of options, see the table of conversion characters. If you specify a conversion that does not fit the data, MATLAB® overrides the specified conversion and uses
%e.
Also, you can specify literal text at the beginning or end of the format. To print a single quotation mark, use ''. To print a percent character, use%%.
'$%.2f'— Display a dollar sign before each value and use fixed-point notation with two decimal values.'%.3f Million'— DisplayMillionafter each value and use fixed-point notation with three decimal values.
| Optional Flag | Description | Example of Numeric Format |
|---|---|---|
| + | Print the sign character (+) for positive values, such as'+100'. | '%+4.4g' |
| 0 | Pad the field width with leading zeros instead of spaces, such as'0100'. | '%04.4g' |
| – | Left-justify, which pads the end of the value with spaces instead of the beginning. For example, if the field width is 4, then this flag formats the label as '100 ' instead of ' 100'. | '%-4.4g' |
| # | For the %f, %e, and%g conversion characters, print the decimal point even when the precision is 0, such as '100.'. For%g, do not remove trailing zeros. | '%#4.4g' |
| Conversion Character | Description | Example |
|---|---|---|
| d or i | Signed integer with base 10. The precision value indicates the number of significant digits. | '%.4d' displays π as 0003. |
| f | Fixed-point notation. The precision value indicates the number of decimal places. | '%.4f' displays π as3.1416. |
| e | Exponential notation. The precision value indicates the number of decimal places. | '%.4e' displays π as3.1416x100. |
| g | The more compact version of e or f, with no trailing zeros. The precision value indicates the maximum number of decimal places. | '%.4g' displays π as3.1416. |
Datetime Formats
This table shows several common formats and includes examples of the formatted input for the date, Saturday, April 19, 2014 at 9:41:06.12345 PM in New York City.
| Value of Format | Example |
|---|---|
| 'yyyy-MM-dd' | 2014-04-19 |
| 'dd/MM/yyyy' | 19/04/2014 |
| 'dd.MM.yyyy' | 19.04.2014 |
| 'yyyy年 MM月 dd日' | 2014年 04月 19日 |
| 'MMMM d, yyyy' | April 19, 2014 |
| 'eeee, MMMM d, yyyy h:mm a' | Saturday, April 19, 2014 9:41 PM |
| 'MMMM d, yyyy HH:mm:ss Z' | April 19, 2014 21:41:06 -0400 |
| 'yyyy-MM-dd''T''HH:mmXXX' | 2014-04-19T21:41-04:00 |
The following tables show the letter identifiers that you can use to construct datetime formats. To separate the fields, use nonletter characters such as a hyphen, space, colon, or any non-ASCII character. The identifiers correspond to the Unicode® Locale Data Markup Language (LDML) standard for dates.
Use the identifiers in this table to specify the display formats of the date and time fields.
| Letter Identifier | Description | Display |
|---|---|---|
| G | Era | CE |
| y | Year, with no leading zeros. See the Note that follows this table. | 2014 |
| yy | Year, using last two digits. See the Note that follows this table. | 14 |
| yyy, yyyy ... | Year, using at least the number of digits specified by the number of instances of 'y' | For the year 2014, 'yyy' displays 2014, while 'yyyyy' displays 02014. |
| u, uu, ... | ISO year. A single number designating the year. An ISO year value assigns positive values to CE years and negative values to BCE years, with 1 BCE being year 0. | 2014 |
| Q | Quarter, using one digit | 2 |
| Quarter, using two digits | 02 | |
| QQQ | Quarter, abbreviated | Q2 |
| QQQQ | Quarter, full name | 2nd quarter |
| M | Month, numerical using one or two digits | 4 |
| MM | Month, numerical using two digits | 04 |
| MMM | Month, abbreviated name | Apr |
| MMMM | Month, full name | April |
| MMMMM | Month, capitalized first letter | A |
| W | Week of the month | 1 |
| d | Day of the month, using one or two digits | 5 |
| dd | Day of the month using two digits | 05 |
| D | Day of the year, using one, two or three digits | 95 |
| DD | Day of the year using two digits | 95 |
| DDD | Day of the year using three digits | 095 |
| e | Day of the week, numerical using one or two digits. | 7, where Sunday is the first day of the week. |
| ee | Day of the week, numerical using two digits | 07 |
| eee | Day, abbreviated name | Sat |
| eeee | Day, full name | Saturday |
| eeeee | Day, capitalized first letter | S |
| a | Day period (AM or PM) | PM |
| h | Hour, 12-hour clock notation using one or two digits | 9 |
| hh | Hour, 12-hour clock notation using two digits | 09 |
| H | Hour, 24-hour clock notation using one or two digits | 21 |
| HH | Hour, 24-hour clock notation using two digits | 21 |
| m | Minute, using one or two digits | 41 |
| mm | Minute, using two digits | 41 |
| s | Second, using one or two digits | 6 |
| ss | Second, using two digits | 06 |
| S, SS, ..., SSSSSSSSS | Fractional second, using the number of digits specified by the number of instances of 'S' (up to 9 digits). | 'SSS' truncates 6.12345 seconds to 123. |
Some tips and considerations:
- If you read a two-digit year number and specify the format as
yoryy, then the pivot year determines the century to which the year belongs. - Use one or more
ucharacters instead ofycharacters to represent the year when working with year numbers near zero. - Datetime values later than 144683 years CE or before 140743 BCE display only the year numbers, regardless of the specified format value.
Use the identifiers in this table to specify the display format of the time zone offset. A time zone offset is the amount of time that a specific date and time is offset from UTC. This is different from a time zone, which comprises rules that determine the offsets for specific times of the year. Include a time zone offset identifier when you want to ensure that the time components are displayed unambiguously.
| Letter Identifier | Description | Display |
|---|---|---|
| z | Abbreviated name of the time zone offset. If this value is not available, then the time zone offset uses the short UTC format, such asUTC-4. | EDT |
| Z | ISO 8601 basic format with hours, minutes, and optional seconds fields. | -0400 |
| ZZZZ | Long UTC format. | UTC-04:00 |
| ZZZZZ | ISO 8601 extended format with hours, minutes, and optional seconds fields. A time offset of zero is displayed as the ISO 8601 UTC indicator “Z”. | -04:00 |
| x or X | ISO 8601 basic format with hours field and optional minutes field. If you specify X, a time offset of zero is displayed as the ISO 8601 UTC indicator “Z”. | -04 |
| xx or XX | ISO 8601 basic format with hours and minutes fields. If you specifyXX, a time offset of zero is displayed as the ISO 8601 UTC indicator “Z”. | -0400 |
| xxx or XXX | ISO 8601 extended format with hours and minutes fields. If you specifyXXX, a time offset of zero is displayed as the ISO 8601 UTC indicator “Z”. | -04:00 |
| xxxx or XXXX | ISO 8601 basic format with hours, minutes, and optional seconds fields. If you specify XXXX, a time offset of zero is displayed as the ISO 8601 UTC indicator “Z”. | -0400 |
| xxxxx or XXXXX | ISO 8601 extended format with hours, minutes, and optional seconds fields. If you specify XXXXX, a time offset of zero is displayed as the ISO 8601 UTC indicator “Z”. | -04:00 |
Duration Formats
Duration formats can be either a single number with time units (such as'0.5 yrs') or a digital timer (such as'hh:mm:ss' for hours, minutes, and seconds).
For numbers with time units, specify one of the following:
'y'— Fixed-length years, where one year equals 365.2425 days'd'— Fixed-length days, where one day equals 24 hours'h'— Hours'm'— Minutes's'— Seconds
For digital timer formats, specify one of the following:
'dd:hh:mm:ss''hh:mm:ss''mm:ss''hh:mm'- Any of the first three formats, with up to nine
Scharacters to indicate fractional second digits, such as'hh:mm:ss.SSSS'
Examples
Add Row to Data Tips
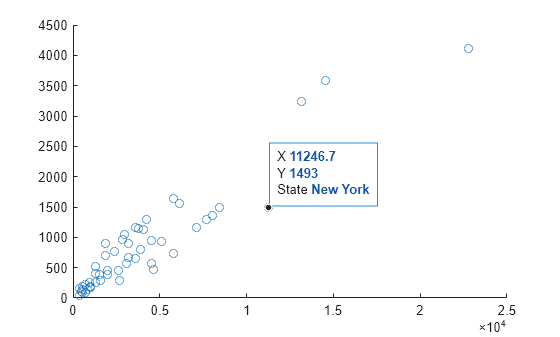
Load sample accident data and create a scatter plot. Then add a third row to the default data tips. For the label, use State. For the value source, use the statelabel workspace variable. After you create the new row, add it to the DataTipTemplate property for the Scatter object.
load('accidents.mat','hwydata','statelabel') s = scatter(hwydata(:,5),hwydata(:,4)); row = dataTipTextRow('State',statelabel); s.DataTipTemplate.DataTipRows(end+1) = row;
Create a data tip interactively or by using the datatip function.
dt = datatip(s,11246.7,1493);
Change Format for Displayed Values
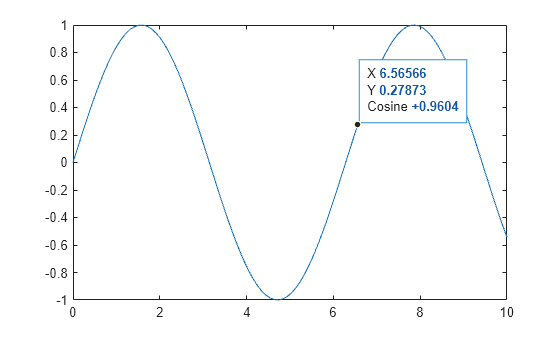
Create a line plot of sine values. Add a third row to the default data tips to show the cosine values. Specify the numeric format for the displayed cosine values. In this case, use '%+4.4g' to include the sign character (+) for positive values. After you create the new row, add it to the DataTipTemplate property for the Line object.
x = linspace(0,10); y1 = sin(x); y2 = cos(x); p = plot(x,y1); row = dataTipTextRow('Cosine',y2,'%+4.4g'); p.DataTipTemplate.DataTipRows(end+1) = row;
Create a data tip interactively or by using the datatip function.
dt = datatip(p,6.56566,0.27873);
Version History
Introduced in R2019a