PanInteraction - Pan interaction - MATLAB (original) (raw)
Main Content
Description
A pan interaction allows you to pan within a chart without having to select any buttons in the axes toolbar. To enable panning, set the Interactions property of the axes to a panInteraction object. When this interaction is enabled, you can pan by dragging within the chart.
When this interaction is enabled on axes with focus, you can pan the view of the axes using the keyboard. To pan vertically, press the up arrow (↑) or down arrow (↓) key. To pan horizontally, press theleft arrow (←) or right arrow (→) key. (since R2024a)
To enable multiple interactions, set the Interactions property to an array of objects.
Creation
Syntax
Description
p = panInteraction creates a pan interaction object.
p = panInteraction('Dimensions',d) sets the Dimensions property. Use this property to constrain panning to specific dimensions. For example, p = panInteraction('Dimensions','x') constrains panning to the_x_-dimension.
Properties
Dimensions — Dimensions
'xyz' (default) | 'xy' | 'yz' | 'xz' | 'x' | 'y' | 'z'
Dimensions to allow panning, specified as one of these values:
'xyz'— Allows panning in all dimensions.'xy'— Allows panning in the x and_y_ dimensions only.'yz'— Allows panning in the y and_z_ dimensions only.'xz'— Allows panning in the x and_z_ dimensions only.'x'— Allows panning in the x dimension only.'y'— Allows panning in the y dimension only.'z'— Allows panning in the z dimension only.
The Dimensions property is only supported for interactions in Cartesian axes.
Examples
Axes with Pan and Data Tip Interactions
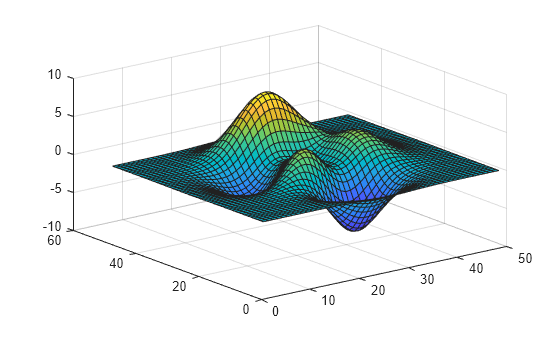
Create a surface plot. Get the current axes and replace the default interactions with the pan and data tip interactions. Then hover over the surface to display data tips. Click and drag or tap and drag to pan.
surf(peaks) ax = gca; ax.Interactions = [panInteraction dataTipInteraction];
Restrict Panning to X-Dimension
Plot a set of x and y values, and adjust the x-axis limits to narrow the view of the plot. Then replace the default set of interactions with a pan interaction that is restricted to the _x_-dimension. Drag within the plot to pan. Notice that you cannot pan vertically.
x = linspace(-500,500,5000); y = sin(x)./x; plot(x,y) xlim([-50 50]) ax = gca; ax.Interactions = panInteraction('Dimensions','x');

Tips
In most cases, the axes have a default set of interactions which depend on the type of chart you are displaying. You can replace the default set with a new set of interactions, but you cannot access or modify any of the interactions in the default set.
Version History
Introduced in R2019a
R2024a: Pan axes using the keyboard
You can pan the view of axes using the keyboard. When the pan interaction is enabled on axes with focus, pan the view of the axes using the arrow keys.