RotateInteraction - Rotate interaction - MATLAB (original) (raw)
Main Content
Description
A rotate interaction allows you to rotate a chart without having to select any buttons in the axes toolbar. To enable chart rotation, set theInteractions property of the axes to arotateInteraction object. When this interaction is enabled, you can rotate a chart by dragging it.
When this interaction is enabled on axes with focus, you can rotate the view of the axes using the keyboard. To increase or decrease the azimuth, press the right arrow (→) or left arrow (←) key. To increase or decrease the elevation, press the up arrow (↑) or down arrow (↓) key. (since R2024a)
To enable multiple interactions, set the Interactions property to an array of objects.
Creation
Syntax
Description
r = rotateInteraction creates a rotate interaction object.
Examples
Axes with Rotate and Data Tip Interactions
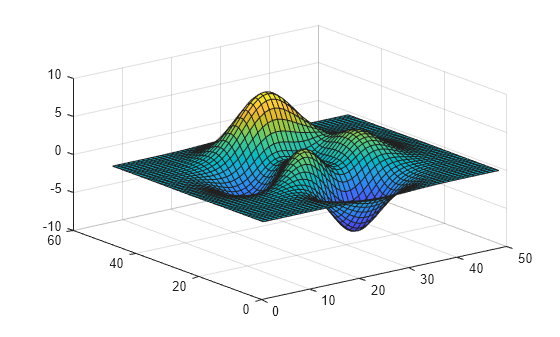
Create a surface plot. Get the current axes and replace the default interactions with the rotate and data tip interactions. Then hover over the surface to display data tips. Drag to rotate the plot.
surf(peaks) ax = gca; ax.Interactions = [rotateInteraction dataTipInteraction];
Tips
In most cases, the axes have a default set of interactions which depend on the type of chart you are displaying. You can replace the default set with a new set of interactions, but you cannot access or modify any of the interactions in the default set.
Version History
Introduced in R2019a
R2024a: Rotate axes using the keyboard
You can rotate the view of axes using the keyboard. When the rotate interaction is enabled on axes with focus, rotate the view of the axes using the arrow keys.