ZoomInteraction - Zoom interaction - MATLAB (original) (raw)
Main Content
Description
A zoom interaction allows you to zoom into a chart without having to select any buttons in the axes toolbar. To enable zooming, set the Interactions property of the axes to a zoomInteraction object. When this interaction is enabled, you can zoom by scrolling or pinching within the chart.
When this interaction is enabled on axes with focus, you can zoom the view of the axes using the keyboard. To zoom in, press thePlus (+) or Equal (=) key. To zoom out, press theMinus (-) key. (since R2024a)
To enable multiple interactions, set the Interactions property to an array of objects.
Creation
Syntax
Description
z = zoomInteraction creates a zoom interaction object.
z = zoomInteraction('Dimensions',d) sets the Dimensions property. Use this property to constrain zooming to specific dimensions. For example, z = zoomInteraction('Dimensions','x') constrains zooming to the_x_-dimension.
Properties
Dimensions — Dimensions
'xyz' (default) | 'xy' | 'yz' | 'xz' | 'x' | 'y' | 'z'
Dimensions to allow zooming, specified as one of these values:
'xyz'— Allows zooming in all dimensions.'xy'— Allows zooming in the x and_y_ dimensions only.'yz'— Allows zooming in the y and_z_ dimensions only.'xz'— Allows zooming in the x and_z_ dimensions only.'x'— Allows zooming in the x dimension only.'y'— Allows zooming in the y dimension only.'z'— Allows zooming in the z dimension only.
The Dimensions property is only supported for interactions in Cartesian axes.
Examples
Axes with Zoom Interaction
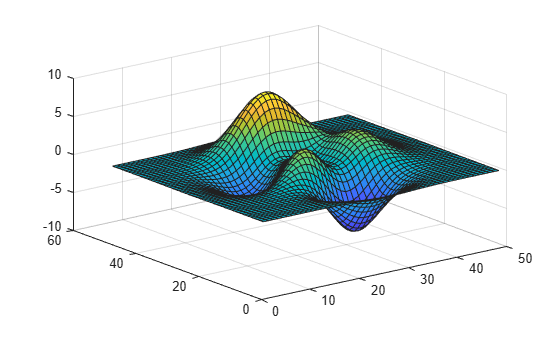
Create a surface plot. Get the current axes and replace the default interactions with just the zoom interaction. Then scroll or pinch to zoom in or out.
surf(peaks) ax = gca; ax.Interactions = zoomInteraction;
Restrict Zooming to X-Dimension
Use the sphere function to define vectors x, y, and z. Then create a scatter plot using those vectors. Replace the default set of interactions with a zoom interaction that is restricted to the _x_-dimension. Then scroll or pinch within the plot to zoom.
[X,Y,Z] = sphere(16); x = [0.5X(:); 0.75X(:); X(:)]; y = [0.5Y(:); 0.75Y(:); Y(:)]; z = [0.5Z(:); 0.75Z(:); Z(:)]; scatter3(x,y,z) xlabel('X') ylabel('Y') zlabel('Z') ax = gca; ax.Interactions = zoomInteraction('Dimensions','x');

Tips
In most cases, the axes have a default set of interactions which depend on the type of chart you are displaying. You can replace the default set with a new set of interactions, but you cannot access or modify any of the interactions in the default set.
Version History
Introduced in R2019a
R2024a: Zoom axes using the keyboard
You can zoom the view of axes using the keyboard. When the zoom interaction is enabled on axes with focus, zoom the view of the axes using the Plus (+) orEqual (=) key to zoom in, and the Minus (-) key to zoom out.