polarhistogram - Histogram chart in polar coordinates - MATLAB (original) (raw)
Histogram chart in polar coordinates

Syntax
Description
polarhistogram([theta](#bvdhkhi-1-theta)) creates a histogram plot in polar coordinates by sorting the values in theta into equally spaced bins. Specify the values in radians.
polarhistogram([theta](#bvdhkhi-1-theta),[nbins](#bvdhkhi-1-nbins)) uses the number of bins specified by the positive integer, nbins.
polarhistogram([theta](#bvdhkhi-1-theta),[edges](#bvdhkhi-1-edges)) sorts theta into bins with bin edges specified by the vector, edges. All bins include the left edge, but only the last bin includes the right edge. In other words, the last bin includes both edges.
polarhistogram('BinEdges',[edges](#bvdhkhi-1-edges),'BinCounts',[counts](#bvdhkhi-1-counts)) uses the manually specified bin edges and associated bin counts. The polarhistogram function does not do any data binning.
polarhistogram(___,[Name,Value](#namevaluepairarguments)) specifies additional options using one or more name-value pair arguments. For example, you can use semitransparent bars by specifying 'FaceAlpha' and a scalar value between 0 and 1.
polarhistogram([pax](#bvdhkhi-1-pax),___) plots into the polar axes specified by pax instead of into the current axes.
`h` = polarhistogram(___) returns the Histogram object. Use h to modify the histogram after it is created. For a list of properties, see Histogram Properties.
Examples
Create Histogram Chart in Polar Coordinates
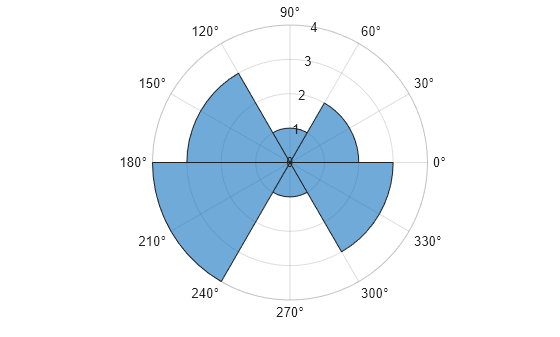
Create a vector of values between 0 and 2π. Create a histogram chart that shows the data sorted into six bins.
theta = [0.1 1.1 5.4 3.4 2.3 4.5 3.2 3.4 5.6 2.3 2.1 3.5 0.6 6.1]; polarhistogram(theta,6)
Before R2022a, polar axes do not include degree symbols by default. To add them, get the polar axes using pax = gca. Then modify the tick labels using pax.ThetaTickLabel = string(pax.ThetaTickLabel) + char(176).
Specify Number of Bins for Polar Histogram Chart
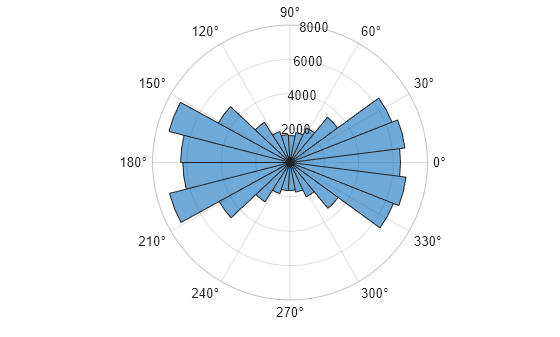
Create a histogram plot from 100,000 values between -π and π, and sort the data into 25 bins.
theta = atan2(rand(100000,1)-0.5,2*(rand(100000,1)-0.5)); polarhistogram(theta,25);
Modify Appearance of Histogram Chart
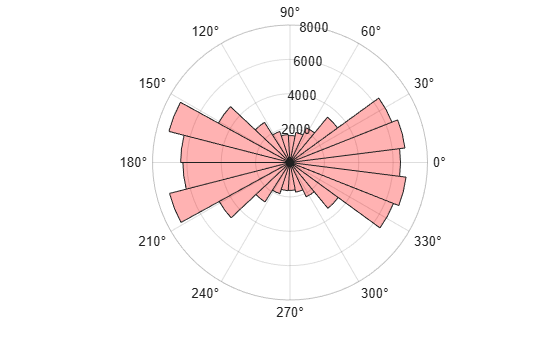
Create a histogram chart in polar coordinates, and then change its appearance. Specify the bar colors by setting the FaceColor property to a character vector of a color name, such as 'red', or an RGB triplet. Specify the transparency by setting the FaceAlpha property to a value between 0 and 1.
theta = atan2(rand(100000,1)-0.5,2*(rand(100000,1)-0.5)); polarhistogram(theta,25,'FaceColor','red','FaceAlpha',.3);
Modify Appearance of Histogram Chart After Creation
Create a histogram chart in polar coordinates. Assign the histogram object to the variable h.
theta = atan2(rand(100000,1)-0.5,2*(rand(100000,1)-0.5)); h = polarhistogram(theta,25)
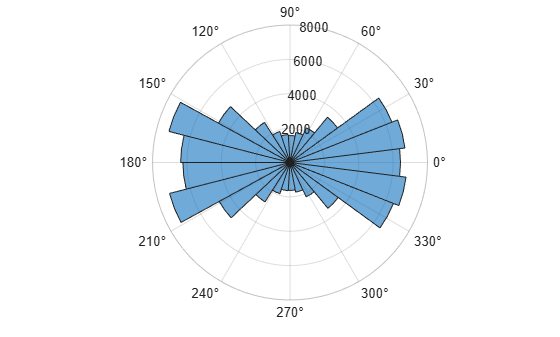
h = Histogram with properties:
         Data: [100000x1 double]
       Values: [6232 7236 4699 2717 1908 1641 1622 1755 2207 3463 6471 6806 6429 6741 6380 3422 2233 1777 1570 1633 1899 2768 4755 7273 6363]
      NumBins: 25
     BinEdges: [-3.1416 -2.8903 -2.6389 -2.3876 -2.1363 -1.8850 -1.6336 -1.3823 -1.1310 -0.8796 -0.6283 -0.3770 -0.1257 0.1257 0.3770 0.6283 0.8796 1.1310 1.3823 1.6336 1.8850 2.1363 2.3876 2.6389 2.8903 3.1416]
     BinWidth: 0.2513
    BinLimits: [-3.1416 3.1416]
Normalization: 'count'
    FaceColor: 'auto'
    EdgeColor: [0 0 0]
Use GET to show all properties
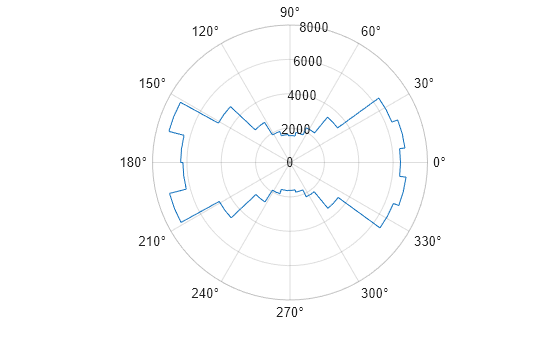
Use h to access and modify properties of the histogram object after it is created. For example, show just the histogram outline by setting the DisplayStyle property of the histogram object.
h.DisplayStyle = 'stairs';
Input Arguments
theta — Data to distribute among bins
vector | matrix
Data to distribute among bins, specified as a vector or a matrix. polarhistogram creates one histogram, regardless of whether you specify a vector or a matrix. Specify the values in radians. To convert degrees to radians, use deg2rad.
Values that correspond to the same angle direction differ by exactly 2π, and are sorted into the same bin. polarhistogram does not include NaN, Inf, and -Inf values in any bin.
Example: theta = [0 0.4 0.5 0.7 2.3 3.0 1.7 0.3];
Data Types: single | double | int8 | int16 | int32 | int64 | uint8 | uint16 | uint32 | uint64
nbins — Number of bins
positive integer
Number of bins, specified as a positive integer. If you do not specify nbins, then polarhistogram automatically calculates how many bins to use based on the values in theta.
Example: nbins = 15;
edges — Bin edges
vector
Bin edges, specified as a vector. The difference between the minimum and maximum edge values must be less than or equal to 2π.
Example: polarhistogram('BinEdges',[0 pi/3 pi 3*pi/2 2*pi],'BinCounts',[5 3 4 6])
counts — Bin counts
vector
Bin counts, specified as a vector. Use this option if you perform the bin counts calculation separately and you do not want polarhistogram to do any data binning.
Example: polarhistogram('BinEdges',[0 pi/3 pi 3*pi/2 2*pi],'BinCounts',[5 3 4 6])
pax — PolarAxes object
PolarAxes object
PolarAxes object. If you do not specify the polar axes, then polarhistogram uses the current axes. polarhistogram does not support plotting into Cartesian axes.
Name-Value Arguments
Specify optional pairs of arguments asName1=Value1,...,NameN=ValueN, where Name is the argument name and Value is the corresponding value. Name-value arguments must appear after other arguments, but the order of the pairs does not matter.
Before R2021a, use commas to separate each name and value, and enclose Name in quotes.
Example: polarhistogram(theta,'FaceAlpha',0.3) creates a histogram chart with semitransparent bars.
The histogram properties listed here are only a subset. For a complete list, see Histogram Properties.
BinLimits — Bin limits
two-element vector
Bin limits, specified as a two-element vector of the form [bmin,bmax], where bmin is less than bmax.
This option plots a histogram using the input array values that fall between bmin and bmax inclusive. That is, theta(theta>=bmin & theta<=bmax).
Example: polarhistogram(theta,'BinLimits',[-pi/2 pi/2]) plots a histogram using only the values in theta that are between -pi/2 and pi/2 inclusive.
BinWidth — Width across top of bins
scalar less than 2π
Width across the top of the bins, specified as a scalar less than 2π.
polarhistogram uses a maximum of 65,536 bins (or 216). If the specified bin width requires more bins, then polarhistogram uses the maximum number of bins and adjust the bin width accordingly.
Example: polarhistogram(theta,'BinWidth',pi) uses bins with a width of π.
Normalization — Type of normalization
'count' (default) | 'probability' | 'countdensity' | 'pdf' | 'cumcount' | 'cdf'
Type of normalization, specified as one of the values in this table.
| Value | Description |
|---|---|
| 'count' | Default normalization scheme. The height of each bar is the number of observations in each bin. The sum of the bar heights is numel(theta). |
| 'probability' | The height of each bar is the relative number of observations. Each height is calculated as (number of observations in bin/total number of observations). The sum of the bar heights is 1. |
| 'countdensity' | The height of each bar is the number of observations in bin/width of bin. |
| 'pdf' | Probability density function estimate. The height of each bar is (number of observations in the bin)/(total number of observations * width of bin). The area of each bar is the relative number of observations. The sum of the bar areas is1. |
| 'cumcount' | The height of each bar is the cumulative number of observations in each bin and all previous bins. The height of the last bar is numel(theta). |
| 'cdf' | Cumulative distribution function estimate. The height of each bar is equal to the cumulative relative number of observations in the bin and all previous bins. The height of the last bar is 1. |
Example: polarhistogram(theta,'Normalization','pdf') plots an estimate of the probability density function for theta.
DisplayStyle — Histogram display style
'bar' (default) | 'stairs'
Histogram display style, specified as one of these values:
'stairs'— Display the histogram outline only.'bar'— Show each individual bar with a filled interior.
Example: polarhistogram(theta,'DisplayStyle','stairs') plots the outline of the histogram.
FaceAlpha — Transparency of histogram bars
0.6 (default) | scalar value between 0 and 1 inclusive
Transparency of histogram bars, specified as a scalar value between 0 and 1 inclusive. polarhistogram uses the same transparency for all the bars of the histogram. A value of 1 means fully opaque and 0 means completely transparent (invisible).
Example: polarhistogram(theta,'FaceAlpha',.5) creates a histogram plot with semi-transparent bars.
FaceColor — Histogram bar color
'auto' (default) | RGB triplet | hexadecimal color code | 'r' | 'g' | 'b' | ...
Histogram bar color, specified as 'auto', an RGB triplet, a hexadecimal color code, a color name, or a short name. The default value of'auto' lets the histogram choose the color.
For a custom color, specify an RGB triplet or a hexadecimal color code.
- An RGB triplet is a three-element row vector whose elements specify the intensities of the red, green, and blue components of the color. The intensities must be in the range
[0,1], for example,[0.4 0.6 0.7]. - A hexadecimal color code is a string scalar or character vector that starts with a hash symbol (
#) followed by three or six hexadecimal digits, which can range from0toF. The values are not case sensitive. Therefore, the color codes"#FF8800","#ff8800","#F80", and"#f80"are equivalent.
Alternatively, you can specify some common colors by name. This table lists the named color options, the equivalent RGB triplets, and hexadecimal color codes.
| Color Name | Short Name | RGB Triplet | Hexadecimal Color Code | Appearance |
|---|---|---|---|---|
| "red" | "r" | [1 0 0] | "#FF0000" |  |
| "green" | "g" | [0 1 0] | "#00FF00" |  |
| "blue" | "b" | [0 0 1] | "#0000FF" |  |
| "cyan" | "c" | [0 1 1] | "#00FFFF" |  |
| "magenta" | "m" | [1 0 1] | "#FF00FF" |  |
| "yellow" | "y" | [1 1 0] | "#FFFF00" |  |
| "black" | "k" | [0 0 0] | "#000000" |  |
| "white" | "w" | [1 1 1] | "#FFFFFF" |  |
| "none" | Not applicable | Not applicable | Not applicable | No color |
Here are the RGB triplets and hexadecimal color codes for the default colors MATLAB® uses in many types of plots.
| RGB Triplet | Hexadecimal Color Code | Appearance |
|---|---|---|
| [0 0.4470 0.7410] | "#0072BD" | ![Sample of RGB triplet [0 0.4470 0.7410], which appears as dark blue](https://www.mathworks.com/help/matlab/ref/colororder1.png) |
| [0.8500 0.3250 0.0980] | "#D95319" | ![Sample of RGB triplet [0.8500 0.3250 0.0980], which appears as dark orange](https://www.mathworks.com/help/matlab/ref/colororder2.png) |
| [0.9290 0.6940 0.1250] | "#EDB120" | ![Sample of RGB triplet [0.9290 0.6940 0.1250], which appears as dark yellow](https://www.mathworks.com/help/matlab/ref/colororder3.png) |
| [0.4940 0.1840 0.5560] | "#7E2F8E" | ![Sample of RGB triplet [0.4940 0.1840 0.5560], which appears as dark purple](https://www.mathworks.com/help/matlab/ref/colororder4.png) |
| [0.4660 0.6740 0.1880] | "#77AC30" | ![Sample of RGB triplet [0.4660 0.6740 0.1880], which appears as medium green](https://www.mathworks.com/help/matlab/ref/colororder5.png) |
| [0.3010 0.7450 0.9330] | "#4DBEEE" | ![Sample of RGB triplet [0.3010 0.7450 0.9330], which appears as light blue](https://www.mathworks.com/help/matlab/ref/colororder6.png) |
| [0.6350 0.0780 0.1840] | "#A2142F" | ![Sample of RGB triplet [0.6350 0.0780 0.1840], which appears as dark red](https://www.mathworks.com/help/matlab/ref/colororder7.png) |
If you specify DisplayStyle as 'stairs', then polarhistogram does not use the FaceColor property.
Example: polarhistogram(theta,'FaceColor','g') creates a histogram plot with green bars.
Limitations
polarhistogramdoes not support creating histograms of categorical data in polar axes.
Version History
Introduced in R2016b