struct - Structure array - MATLAB (original) (raw)
Description
A structure array is a data type that groups related data using data containers called fields. Each field can contain any type of data. Access data in a field using dot notation of the formstructName.fieldName.
Creation
When you have data to put into a new structure, create the structure using dot notation to name its fields one at a time:
s.a = 1; s.b = {'A','B','C'}
s = struct with fields: a: 1 b: {'A' 'B' 'C'}
Field names can contain ASCII letters (A–Z, a–z), digits (0–9), and underscores, and must begin with a letter. The maximum length of a field name isnamelengthmax.
You also can create a structure array using the struct function, described below. You can specify many fields simultaneously, or create a nonscalar structure array.
Syntax
Description
s = struct creates a scalar (1-by-1) structure with no fields.
s = struct([field](#d126e1737511),[value](#d126e1737530)) creates a structure array with the specified field and value. Thevalue input argument can be any data type, such as a numeric, logical, character, or cell array.
- If
valueis not a cell array, or ifvalueis a scalar cell array, thensis a scalar structure. For instance,s = struct('a',[1 2 3])creates a 1-by-1 structure, wheres.a = [1 2 3]. - If
valueis a nonscalar cell array, thensis a structure array with the same dimensions asvalue. Each element ofscontains the corresponding element ofvalue. For example,s = struct('x',{'a','b'})returnss(1).x = 'a'ands(2).x = 'b'. - If
valueis an empty cell array{}, thensis an empty (0-by-0) structure.
s = struct(field1,value1,...,fieldN,valueN) creates a structure array with multiple fields.
- If none of the
valueinputs are cell arrays, or if allvalueinputs that are cell arrays are scalars, thensis a scalar structure. - If any of the
valueinputs is a nonscalar cell array, thenshas the same dimensions as that cell array. Also, if two or morevalueinputs are nonscalar cell arrays, then they all must have the same dimensions.
For anyvaluethat is a scalar cell array or an array of any other data type,structinserts the contents ofvaluein the relevant field for all elements ofs. For example,s = struct('x',{'a','b'},'y','c')returnss(1).x = 'a',s(2).x = 'b',s(1).y = 'c', ands(2).y = 'c'. - If any
valueinput is an empty cell array,{}, then outputsis an empty (0-by-0) structure. To specify an empty field and keep the values of the other fields, use[]as avalueinput instead.
s = struct([]) creates an empty (0-by-0) structure with no fields.
s = struct([obj](#d126e1737559)) creates a scalar structure with field names and values that correspond to properties ofobj. The struct function does not convert obj, but rather creates s as a new structure. This structure does not retain the class information, so private, protected, and hidden properties become public fields ins. The struct function issues a warning when you use this syntax.
Input Arguments
field — Field name
character vector | string scalar
Field name, specified as a character vector or string scalar.
value — Values
array
Values, specified as any type of array. If anyvalue input is a nonscalar cell array, then all nonscalar cell array inputs must have the same dimensions.
If any value input is an empty cell array,{}, then the output is an empty structure array. To specify a single empty field, use [].
obj — Object
object
The struct function copies the properties ofobj to the fields of a new scalar structure.
The struct function does not create a structure from most of the fundamental data types. For example, ifobj has the double orchar data type, thenstruct issues an error message. However,struct does return the properties of a table or timetable as a structure. See Fundamental MATLAB Classes for the list of fundamental data types.
Examples
Store Related Data Variables in Structure
Store related pieces of data in the fields of a structure. You can give the fields human-readable names that describe the data.
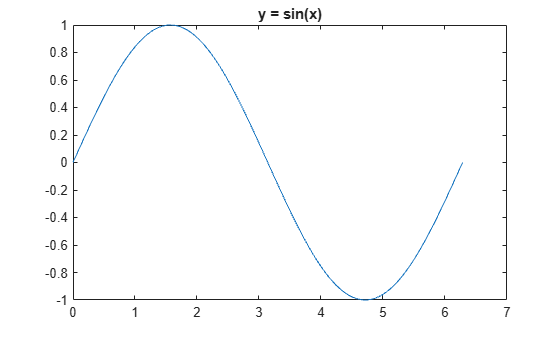
Create a structure by adding fields to it using dot notation. The fields contain x- and y-values for a sine wave, and text that describes the data.
data.x = linspace(0,2*pi); data.y = sin(data.x); data.title = 'y = sin(x)'
data = struct with fields: x: [0 0.0635 0.1269 0.1904 0.2539 0.3173 0.3808 0.4443 0.5077 0.5712 0.6347 0.6981 0.7616 0.8251 0.8885 0.9520 1.0155 1.0789 1.1424 1.2059 1.2693 1.3328 1.3963 1.4597 1.5232 1.5867 1.6501 1.7136 1.7771 1.8405 1.9040 1.9675 ... ] (1x100 double) y: [0 0.0634 0.1266 0.1893 0.2511 0.3120 0.3717 0.4298 0.4862 0.5406 0.5929 0.6428 0.6901 0.7346 0.7761 0.8146 0.8497 0.8815 0.9096 0.9341 0.9549 0.9718 0.9848 0.9938 0.9989 0.9999 0.9969 0.9898 0.9788 0.9638 0.9450 0.9224 ... ] (1x100 double) title: 'y = sin(x)'
Plot the sine wave. You can refer to the arrays of x- and y-values by their field names. Then add the title.
plot(data.x,data.y) title(data.title)
Structure with One Field
Create a nonscalar structure that contains a single field.
field = 'f'; value = {'some text'; [10, 20, 30]; magic(5)}; s = struct(field,value)
s=3×1 struct array with fields: f
View the contents of each element.
ans = 5×5
17    24     1     8    15
23     5     7    14    16
 4     6    13    20    22
10    12    19    21     3
11    18    25     2     9
When you access a field of a nonscalar structure, such as s.f, MATLAB® returns a comma-separated list. In this case, s.f is equivalent to s(1).f, s(2).f, s(3).f.
Structure with Multiple Fields
Create a nonscalar structure that contains several fields.
field1 = 'f1'; value1 = zeros(1,10); field2 = 'f2'; value2 = {'a', 'b'}; field3 = 'f3'; value3 = {pi, pi.^2}; field4 = 'f4'; value4 = {'fourth'};
s = struct(field1,value1,field2,value2,field3,value3,field4,value4)
s=1×2 struct array with fields: f1 f2 f3 f4
The cell arrays for value2 and value3 are 1-by-2, so s is also 1-by-2. Because value1 is a numeric array and not a cell array, both s(1).f1 and s(2).f1 have the same contents. Similarly, because the cell array for value4 has a single element, s(1).f4 and s(2).f4 have the same contents.
ans = struct with fields: f1: [0 0 0 0 0 0 0 0 0 0] f2: 'a' f3: 3.1416 f4: 'fourth'
ans = struct with fields: f1: [0 0 0 0 0 0 0 0 0 0] f2: 'b' f3: 9.8696 f4: 'fourth'
Structure with Empty Field
Create a structure that contains an empty field. Use [] to specify the value of the empty field.
s = struct('f1','a','f2',[])
s = struct with fields: f1: 'a' f2: []
Fields with Cell Arrays
Create a structure with a field that contains a cell array.
field = 'mycell'; value = {{'a','b','c'}}; s = struct(field,value)
s = struct with fields: mycell: {'a' 'b' 'c'}
Empty Structure
Create an empty structure that contains several fields.
s = struct('a',{},'b',{},'c',{})
s =
0x0 empty struct array with fields:
a
b
c
Assign a value to a field in an empty structure.
s = struct with fields: a: 'a' b: [] c: []
Nested Structure
Create a nested structure, where a is a structure with a field that contains another structure.
a.b = struct('c',{},'d',{})
a = struct with fields: b: [0x0 struct]
View the names of the fields of a.b.
ans = 2x1 cell {'c'} {'d'}
Extended Capabilities
C/C++ Code Generation
Generate C and C++ code using MATLAB® Coder™.
Usage notes and limitations:
- If the
valueargument is a cell array, all elements must have the same type. - Struct array field names must have the same length. For example, this code errors because
'my_int'and'my_double'are different lengths:
param1.name = 'my_int';
param1.value = int32(1);
param2.name = 'my_double';
param2.value = 2.0;
params = [param1, param2];
Thread-Based Environment
Run code in the background using MATLAB® backgroundPool or accelerate code with Parallel Computing Toolbox™ ThreadPool.
This function fully supports thread-based environments. For more information, see Run MATLAB Functions in Thread-Based Environment.
Version History
Introduced before R2006a
R2023b: Partial contents as well as size and data type of arrays in structure fields are displayed
Between R2021b and R2023b, MATLAB® displayed the entire contents of an array in a structure field if the contents fit in the display. If the array did not fit, MATLAB showed as much of the array as the display allowed.
Starting in R2023b, if the entire contents of an array in a field do not fit in the display, MATLAB shows as much of the array as the display allows, as well as the size and data type of the array. For example, as of R2023b, MATLAB displays partial contents as well as the size and data type for two fields that contain arrays of 100 double values.
data.x = linspace(0,2*pi); data.y = sin(data.x); data
data =
struct with fields:
x: [0 0.0635 0.1269 0.1904 0.2539 0.3173 0.3808 … ] (1×100 double)
y: [0 0.0634 0.1266 0.1893 0.2511 0.3120 0.3717 … ] (1×100 double)
If the first element of the array is itself too large to display, such as an enumeration member with a long name, MATLAB displays only the size and data type of the array.
The disp function follows the same behavior.
R2021b: Partial contents of arrays in structure fields are displayed instead of size and data type
Before R2021b, MATLAB displayed the entire contents of an array in a structure field if the contents fit in the display. If the array did not fit, MATLAB displayed the size and data type of the array.
Starting in R2021b, if the entire contents of an array do not fit in the display, MATLAB shows as much of the array as the display allows instead of the size and data type. For example, as of R2021b, MATLAB displays partial contents of two structure fields that contain arrays of 100 double values.
data.x = linspace(0,2*pi); data.y = sin(data.x); data
data =
struct with fields:
 x: [0 0.0635 0.1269 0.1904 0.2539 0.3173 0.3808 0.4443 0.5077 … ]
 y: [0 0.0634 0.1266 0.1893 0.2511 0.3120 0.3717 0.4298 0.4862 … ]
If the first element of the array is itself too large to display, such as an enumeration member with a long name, MATLAB displays only the size and data type of the array.
The disp function follows the same behavior.
R2019a: Structure array expansion is consistent with general array expansion
Starting in R2019a, the dimensions of an expanded structure array are consistent whether you assign a value to a single field using dot notation or assign an entire structure to the array. Previously, the output dimensions were different when you did not specify indices for all dimensions. Assigning to a field using dot notation now matches the previous behavior of assigning a structure, which is consistent with general array expansion. For example:
- If
Sis 1-by-2-by-3-by-4, thenS(5,2)=struct('a',3)andS(5,2).a=3both expandSto 5-by-2-by-3-by-4. Previously,S(5,2).a=3resulted in a 5-by-24 array. - If
Sis 0-by-5 or 5-by-0, thenS(3)=struct('a',2)andS(3).a=2both expandSto 1-by-3. Previously,S(3).a=1resulted in a 1-by-5 array whenSwas 0-by-5 and in a 3-by-1 array whenSwas 5-by-0. - If
Sis 0-by-2-by-3, thenS(3) = struct('a',2)andS(3).a=2produce errors because it is ambiguous which dimension to expand. Previously,S(3).a=2resulted in a 1-by-6 array. - If
Sis 1-by-1-by-3 with two fields, thenS(5)=struct('a',7,'b',[])andS(5).a=7both expandSto 1-by-1-by-5. Previously,S(5).a=7resulted in a 1-by-5 array. - If
Sis 0-by-1 with two fields, thenS(5)=struct('a',7,'b',[])andS(5).a=7both expandSto 5-by-1. Previously,S(5).a=7resulted in a 1-by-5 array.