text - Add text descriptions to data points - MATLAB (original) (raw)
Add text descriptions to data points
Syntax
Description
text([x](#f68-481090-x),[y](#f68-481090-y),[txt](#f68-481090-txt)) adds a text description to one or more data points in the current axes using the text specified by txt. To add text to one point, specifyx and y as scalars. To add text to multiple points, specify x and y as vectors with equal length.
text([x](#f68-481090-x),[y](#f68-481090-y),[z](#f68-481090-z),[txt](#f68-481090-txt)) positions the text in 3-D coordinates.
text(___,[Name,Value](#namevaluepairarguments)) specifies Text object properties using one or more name-value pairs. For example, 'FontSize',14 sets the font size to 14 points. You can specify text properties with any of the input argument combinations in the previous syntaxes. If you specify the Position and String properties as name-value pairs, then you do not need to specify the x, y, z, and txt inputs.
text([ax](#f68-481090-ax),___) creates the text in the Cartesian, polar, or geographic axes specified by ax instead of in the current axes (gca). The optionax can precede any of the input argument combinations in the previous syntaxes.
[t](#f68-481090-t) = text(___) returns one or more text objects. Use t to modify properties of the text objects after they are created. For a list of properties and descriptions, see Text Properties. You can specify an output with any of the previous syntaxes.
Examples
Add Text Description to Data Point
Plot a sine curve. At the point (π,0), add the text description sin(π). Use the TeX markup \pi for the Greek letter π. Use \leftarrow to display a left-pointing arrow.
x = 0:pi/20:2*pi; y = sin(x); plot(x,y) text(pi,0,'\leftarrow sin(\pi)')

For a list of Greek characters and other TeX markup, see the Interpreter property description.
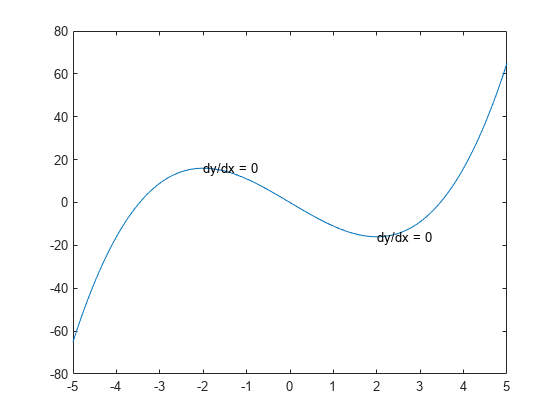
Add Text to Multiple Data Points
Plot a line. Add the same text to two points along the line.
x = linspace(-5,5); y = x.^3-12*x; plot(x,y)
xt = [-2 2]; yt = [16 -16]; str = 'dy/dx = 0'; text(xt,yt,str)
Add different text to each point by specifying str as a cell array.
x = linspace(-5,5); y = x.^3-12*x; plot(x,y)
xt = [-2 2]; yt = [16 -16]; str = {'local max','local min'}; text(xt,yt,str)

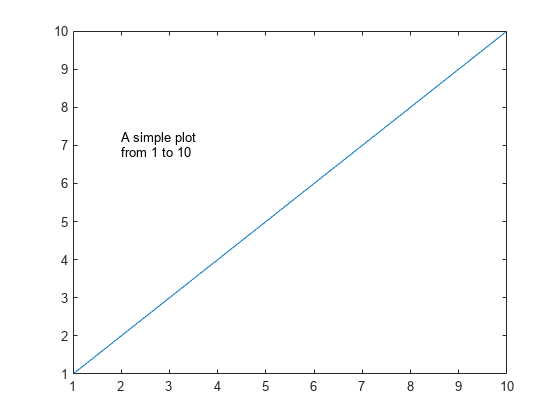
Display Multiline Text
Create a line plot and add one text description to the axes. Display multiline text by specifying str as a cell array.
plot(1:10) str = {'A simple plot','from 1 to 10'}; text(2,7,str)
Create a line plot and add two text descriptions to the axes. When adding multiple text descriptions to the axes, display multiline text by specifying nested cell arrays.
plot(1:10) str = {{'A simple plot','from 1 to 10'},'y = x'}; text([2 8],[7 7],str)

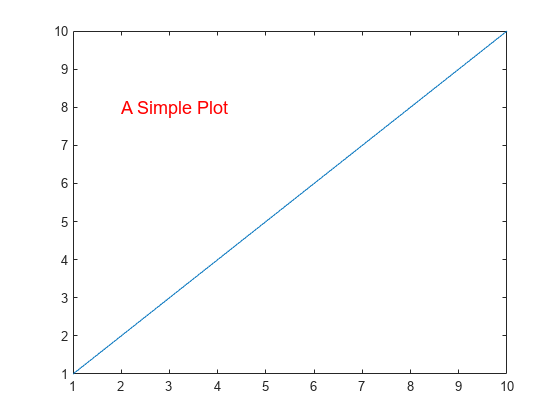
Specify Text Size and Color
Create a line plot and add a text description to the axes. Use red, size 14 font.
plot(1:10) text(2,8,'A Simple Plot','Color','red','FontSize',14)
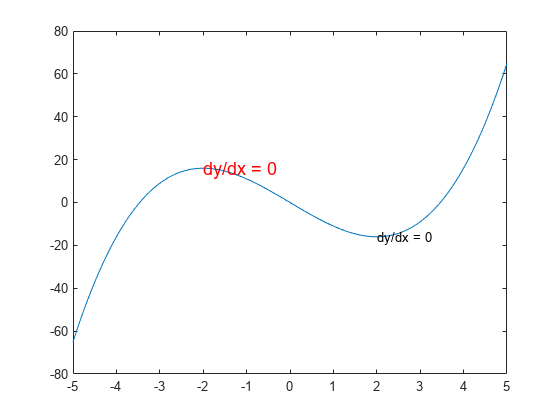
Modify Existing Text
Create a line plot and add two text descriptions along the line. Return the text objects, t.
x = linspace(-5,5); y = x.^3-12*x; plot(x,y) t = text([-2 2],[16 -16],'dy/dx = 0')

t = 2x1 Text array:
Text (dy/dx = 0) Text (dy/dx = 0)
The text function creates one text object for each text description. Thus, t contains two text objects.
Change the color and font size for the first text object using t(1). Use dot notation to set properties. If you are using an earlier release, use the set function instead.
t(1).Color = 'red'; t(1).FontSize = 14;
Include Text in Axes Limits
Use the AffectAutoLimits property to include the anchor point of the Text object in the axes limits. Setting this property can help you to locate and fine-tune the position of your text.
Create a plot of a sine wave.
x = 0:0.1:10; y = sin(x); plot(x,y)
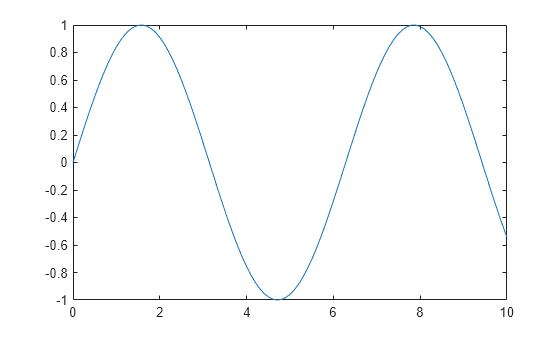
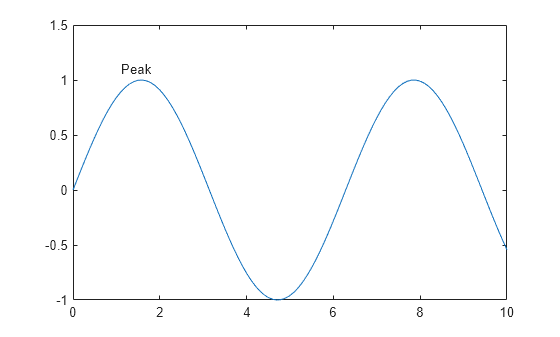
Create a text object outside of the current _y_-axis limits. Set the AffectAutoLimits property to "on" so that the axes limits adjust to include the anchor point of the text.
text(1.1,1.1,"Peak",AffectAutoLimits="on")
Input Arguments
x — First coordinate
scalar | vector
First coordinate, specified in one of these forms:
- Scalar — Add text to a single point.
- Vector — Add text to multiple points.
The interpretation of the first coordinate depends on the type of axes:
- For Cartesian axes, the first coordinate is_x_-axis position in data units. To change units, set the Units property for the
Textobject. - For polar axes, the first coordinate is the polar angle_θ_ in radians.
- For geographic axes, the first coordinate is latitude in degrees.
x and y must be equal sizes.
To control the placement of the text with relation to the specified point, use the HorizontalAlignment, VerticalAlignment, and Extent properties of the Text object.
Data Types: single | double | int8 | int16 | int32 | int64 | uint8 | uint16 | uint32 | uint64 | categorical | datetime | duration
y — Second coordinate
scalar | vector
Second coordinate, specified in one of these forms:
- Scalar — Add text to a single point.
- Vector — Add text to multiple points.
The interpretation of the second coordinate depends on the type of axes:
- For Cartesian axes, the second coordinate is_y_-axis position in data units. To change units, set the Units property for the
Textobject. - For polar axes, the second coordinate is the radius in data units.
- For geographic axes, the second coordinate is longitude in degrees.
x and y must be equal sizes.
To control the placement of the text with relation to the specified point, use the HorizontalAlignment, VerticalAlignment, and Extent properties of the Text object.
Data Types: single | double | int8 | int16 | int32 | int64 | uint8 | uint16 | uint32 | uint64 | categorical | datetime | duration
z — Third coordinate
0 (default) | scalar | vector
Third coordinate, specified in one of these forms:
- Scalar — Add text to a single point.
- Vector — Add text to multiple points.
The interpretation of the third coordinate depends on the type of axes:
- For Cartesian axes, the third coordinate is_z_-axis position in data units. To change units, set the Units property for the
Textobject. - For polar and geographic axes, the third coordinate affects the layering of text on the axes.
x, y, andz must be equal sizes.
To control the placement of the text with relation to the specified point, use the HorizontalAlignment, VerticalAlignment, and Extent properties of the Text object.
Data Types: single | double | int8 | int16 | int32 | int64 | uint8 | uint16 | uint32 | uint64 | categorical | datetime | duration
txt — Text to display
character vector | string scalar | character array | string array | cell array | categorical array
Text to display, specified as a character vector, string scalar, character array, string array, cell array, or categorical array.
Text for Single Data Point
To add text to a single point, specify txt as a character vector or string scalar. For example, text(.5,.5,'my text').
For multiline text:
- Use a cell array, where each cell contains a line of text. For example,
text(.5,.5,{'first','second'}). - Use a string array, where each element is a line of text. For example,
text(.5,.5,["first","second"]). - Use a character array with multiple rows, where each row contains the same number of characters. For example,
text(.5,.5,['first '; 'second']). - Use
sprintfto create a new line character. For example,text(.5,.5,sprintf('first \nsecond')).
If you specify the text as a categorical array, MATLAB® uses the values in the array, not the categories.
Text for Multiple Data Points
To display the same text at each location, specify txt as a character vector or string. For example, text([0 1],[0 1],'my text').
To display different text at each location, use a cell array. For example, text([0 1],[0 1],{'first','second'}).
For multiline text, use nested cell arrays. For example, text([0 1],[0 1],{{'first','new line'},'second'}).
Greek Letters, Special Characters, and Numeric Variables
To include special characters, such as superscripts, subscripts, Greek letters, or mathematical symbols, use TeX markup. For a list of supported markup, see the Interpreter property.
To include numeric variables in the text, use the num2str function.
v = 42; txt = ['The value is ',num2str(v)];
ax — Target axes
Axes object | PolarAxes object | GeographicAxes object
Target axes, specified as an Axes object, aPolarAxes object, or aGeographicAxes object. If you do not specify the axes, then text uses the current axes.
Name-Value Arguments
Specify optional pairs of arguments asName1=Value1,...,NameN=ValueN, where Name is the argument name and Value is the corresponding value. Name-value arguments must appear after other arguments, but the order of the pairs does not matter.
Before R2021a, use commas to separate each name and value, and enclose Name in quotes.
Example: text(.5,.5,'my text','FontSize',14,'Color','red')
Note
The properties listed here are only a subset. For a full list, see Text Properties.
Font size, specified as a scalar value greater than zero in point units. The default font size depends on the specific operating system and locale. One point equals1/72 inch. To change the font units, use theFontUnits property.
Example: 12
Data Types: single | double | int8 | int16 | int32 | int64 | uint8 | uint16 | uint32 | uint64
Character thickness, specified as 'normal' or'bold'.
MATLAB uses the FontWeight property to select a font from those available on your system. Not all fonts have a bold weight. Therefore, specifying a bold font weight can still result in the normal font weight.
Font name, specified as a supported font name or "FixedWidth". To display and print text properly, you must choose a font that your system supports. The default font depends on your operating system and locale.
To use a fixed-width font that looks good in any locale, use "FixedWidth". The fixed-width font relies on the root FixedWidthFontName property. Setting the root FixedWidthFontName property causes an immediate update of the display to use the new font.
Text color, specified as an RGB triplet, a hexadecimal color code, a color name, or a short name. The default value of [0 0 0] corresponds to black.
For a custom color, specify an RGB triplet or a hexadecimal color code.
- An RGB triplet is a three-element row vector whose elements specify the intensities of the red, green, and blue components of the color. The intensities must be in the range
[0,1], for example,[0.4 0.6 0.7]. - A hexadecimal color code is a string scalar or character vector that starts with a hash symbol (
#) followed by three or six hexadecimal digits, which can range from0toF. The values are not case sensitive. Therefore, the color codes"#FF8800","#ff8800","#F80", and"#f80"are equivalent.
Alternatively, you can specify some common colors by name. This table lists the named color options, the equivalent RGB triplets, and hexadecimal color codes.
| Color Name | Short Name | RGB Triplet | Hexadecimal Color Code | Appearance |
|---|---|---|---|---|
| "red" | "r" | [1 0 0] | "#FF0000" |  |
| "green" | "g" | [0 1 0] | "#00FF00" |  |
| "blue" | "b" | [0 0 1] | "#0000FF" |  |
| "cyan" | "c" | [0 1 1] | "#00FFFF" |  |
| "magenta" | "m" | [1 0 1] | "#FF00FF" |  |
| "yellow" | "y" | [1 1 0] | "#FFFF00" |  |
| "black" | "k" | [0 0 0] | "#000000" |  |
| "white" | "w" | [1 1 1] | "#FFFFFF" |  |
| "none" | Not applicable | Not applicable | Not applicable | No color |
Here are the RGB triplets and hexadecimal color codes for the default colors MATLAB uses in many types of plots.
| RGB Triplet | Hexadecimal Color Code | Appearance |
|---|---|---|
| [0 0.4470 0.7410] | "#0072BD" | ![Sample of RGB triplet [0 0.4470 0.7410], which appears as dark blue](https://www.mathworks.com/help/matlab/ref/colororder1.png) |
| [0.8500 0.3250 0.0980] | "#D95319" | ![Sample of RGB triplet [0.8500 0.3250 0.0980], which appears as dark orange](https://www.mathworks.com/help/matlab/ref/colororder2.png) |
| [0.9290 0.6940 0.1250] | "#EDB120" | ![Sample of RGB triplet [0.9290 0.6940 0.1250], which appears as dark yellow](https://www.mathworks.com/help/matlab/ref/colororder3.png) |
| [0.4940 0.1840 0.5560] | "#7E2F8E" | ![Sample of RGB triplet [0.4940 0.1840 0.5560], which appears as dark purple](https://www.mathworks.com/help/matlab/ref/colororder4.png) |
| [0.4660 0.6740 0.1880] | "#77AC30" | ![Sample of RGB triplet [0.4660 0.6740 0.1880], which appears as medium green](https://www.mathworks.com/help/matlab/ref/colororder5.png) |
| [0.3010 0.7450 0.9330] | "#4DBEEE" | ![Sample of RGB triplet [0.3010 0.7450 0.9330], which appears as light blue](https://www.mathworks.com/help/matlab/ref/colororder6.png) |
| [0.6350 0.0780 0.1840] | "#A2142F" | ![Sample of RGB triplet [0.6350 0.0780 0.1840], which appears as dark red](https://www.mathworks.com/help/matlab/ref/colororder7.png) |
Example: 'blue'
Example: [0 0 1]
Example: '#0000FF'
Horizontal alignment of the text with respect to the x value in the Position property, specified as one of the values in this table. The vertical line indicates where the x value lies in relation to the text.
| Value | Result |
|---|---|
| 'left' (default) |  |
| 'center' |  |
| 'right' |  |
Location of the text, specified as a two-element vector of the form [x y] or a three-element vector of the form [x y z]. If you omit the third element, z, then MATLAB sets it to 0.
Specify the position using numeric values. To convert datetime or duration values to the appropriate numeric values for a particular coordinate direction, see ruler2num.
By default, the position value is defined in data units. To change the units, use the Units property.
Example: [0.5 0.5 0]
Data Types: double | single | int8 | int16 | int32 | int64 | uint8 | uint16 | uint32 | uint64
Position units, specified as one of the values in this table.
| Units | Description |
|---|---|
| 'data' (default) | Data coordinates. |
| 'normalized' | Normalized with respect to the axes. The lower left corner of the axes maps to (0,0) and the upper right corner maps to (1,1). |
| 'inches' | Inches. |
| 'centimeters' | Centimeters. |
| 'characters' | Based on the default system font character size. Character width = width of letterx.Character height = distance between the baselines of two lines of text. |
| 'points' | Points. One point equals 1/72 inch. |
| 'pixels' | Pixels.Starting in R2015b, distances in pixels are independent of your system resolution on Windows® and Macintosh systems: On Windows systems, a pixel is 1/96th of an inch.On Macintosh systems, a pixel is 1/72nd of an inch.On Linux® systems, the size of a pixel is determined by your system resolution. |
All units, except for 'data', are measured from the lower left corner of the axes. This property affects the Position and Extent properties.
If you specify the Position and Units properties as Name,Value pairs when creating the Text object, then the order of specification matters. To define the position with particular units, set the Units property before the Position property.
Text interpreter, specified as one of these values:
'tex'— Interpret characters using a subset of TeX markup.'latex'— Interpret characters using LaTeX markup.'none'— Display literal characters.
TeX Markup
By default, MATLAB supports a subset of TeX markup. Use TeX markup to add superscripts and subscripts, modify the font type and color, and include special characters in the text.
Modifiers remain in effect until the end of the text. Superscripts and subscripts are an exception because they modify only the next character or the characters within the curly braces. When you set the interpreter to 'tex', the supported modifiers are as follows.
| Modifier | Description | Example |
|---|---|---|
| ^{ } | Superscript | 'text^{superscript}' |
| _{ } | Subscript | 'text_{subscript}' |
| \bf | Bold font | '\bf text' |
| \it | Italic font | '\it text' |
| \sl | Oblique font (usually the same as italic font) | '\sl text' |
| \rm | Normal font | '\rm text' |
| \fontname{specifier} | Font name — Replace_specifier_ with the name of a font family. You can use this in combination with other modifiers. | '\fontname{Courier} text' |
| \fontsize{specifier} | Font size —Replace_specifier_ with a numeric scalar value in point units. | '\fontsize{15} text' |
| \color{specifier} | Font color — Replace_specifier_ with one of these colors: red, green,yellow, magenta,blue, black,white, gray,darkGreen, orange, orlightBlue. | '\color{magenta} text' |
| \color[rgb]{specifier} | Custom font color — Replace_specifier_ with a three-element RGB triplet. | '\color[rgb]{0,0.5,0.5} text' |
This table lists the supported special characters for the'tex' interpreter.
| Character Sequence | Symbol | Character Sequence | Symbol | Character Sequence | Symbol |
|---|---|---|---|---|---|
| \alpha | α | \upsilon | υ | \sim | ~ |
| \angle | ∠ | \phi | ϕ | \leq | ≤ |
| \ast | * | \chi | χ | \infty | ∞ |
| \beta | β | \psi | ψ | \clubsuit | ♣ |
| \gamma | γ | \omega | ω | \diamondsuit | ♦ |
| \delta | δ | \Gamma | Γ | \heartsuit | ♥ |
| \epsilon | ϵ | \Delta | Δ | \spadesuit | ♠ |
| \zeta | ζ | \Theta | Θ | \leftrightarrow | ↔ |
| \eta | η | \Lambda | Λ | \leftarrow | ← |
| \theta | θ | \Xi | Ξ | \Leftarrow | ⇐ |
| \vartheta | ϑ | \Pi | Π | \uparrow | ↑ |
| \iota | ι | \Sigma | Σ | \rightarrow | → |
| \kappa | κ | \Upsilon | ϒ | \Rightarrow | ⇒ |
| \lambda | λ | \Phi | Φ | \downarrow | ↓ |
| \mu | µ | \Psi | Ψ | \circ | º |
| \nu | ν | \Omega | Ω | \pm | ± |
| \xi | ξ | \forall | ∀ | \geq | ≥ |
| \pi | π | \exists | ∃ | \propto | ∝ |
| \rho | ρ | \ni | ∍ | \partial | ∂ |
| \sigma | σ | \cong | ≅ | \bullet | • |
| \varsigma | ς | \approx | ≈ | \div | ÷ |
| \tau | τ | \Re | ℜ | \neq | ≠ |
| \equiv | ≡ | \oplus | ⊕ | \aleph | ℵ |
| \Im | ℑ | \cup | ∪ | \wp | ℘ |
| \otimes | ⊗ | \subseteq | ⊆ | \oslash | ∅ |
| \cap | ∩ | \in | ∈ | \supseteq | ⊇ |
| \supset | ⊃ | \lceil | ⌈ | \subset | ⊂ |
| \int | ∫ | \cdot | · | \o | ο |
| \rfloor | ⌋ | \neg | ¬ | \nabla | ∇ |
| \lfloor | ⌊ | \times | x | \ldots | ... |
| \perp | ⊥ | \surd | √ | \prime | ´ |
| \wedge | ∧ | \varpi | ϖ | \0 | ∅ |
| \rceil | ⌉ | \rangle | 〉 | \mid | | |
| \vee | ∨ | \langle | 〈 | \copyright | © |
LaTeX Markup
To use LaTeX markup, set the interpreter to 'latex'. For inline mode, surround the markup with single dollar signs ($). For display mode, surround the markup with double dollar signs ($$).
| LaTeX Mode | Example | Result |
|---|---|---|
| Inline | '$\int_1^{20} x^2 dx$' |  |
| Display | '$$\int_1^{20} x^2 dx$$' |  |
The displayed text uses the default LaTeX font style. TheFontName, FontWeight, andFontAngle properties do not have an effect. To change the font style, use LaTeX markup.
The maximum size of the text that you can use with the LaTeX interpreter is 1200 characters. For multiline text, this reduces by about 10 characters per line.
For examples that use TeX and LaTeX, see Greek Letters and Special Characters in Chart Text. For more information about the LaTeX system, see The LaTeX Project website at https://www.latex-project.org/.
Output Arguments
t — Text objects
Text objects
Text objects. Use the elements of t to modify a specific Text object after it is created. For a list of properties, see Text Properties.
Tips
- By default, the Clipping property for text objects is set to
"off"so the text might appear outside the axes. To clip the text to the axes boundaries, set the property to"on". - The words
"default","remove", and"factory"are reserved words in MATLAB. To create text using one of these words, append a backslash (\) before the word; for example,text(.5,.5,"\default").
Version History
Introduced before R2006a