Stateflow.Transition - Transition in chart, state, box, or function - MATLAB (original) (raw)
Transition in chart, state, box, or function
Description
Creation
Syntax
Description
`transition` = Stateflow.Transition([parent](#transition%5Fsep%5Fmw%5F62b5a780-fad8-49c5-adee-9aacc7de28ac)) creates a Stateflow.Transition object in a parent chart, state, box, or graphical function.
Input Arguments
Properties
Stateflow API objects have properties that correspond to the values you set in the Stateflow Editor. To access or modify a property, use dot notation. To access or modify multiple properties for multiple API objects, use the get andset functions, respectively. For more information, see Modify Properties and Call Functions of Stateflow Objects.
Content
This property is read-only.
This property is read-only.
This property is read-only.
Execution order for the transition when its source is active, specified as an integer scalar. This property applies only when theUserSpecifiedStateTransitionExecutionOrder property of the chart that contains the transition is true. For more information, see Transition Evaluation Order.
Whether to comment out the transition, specified as a numeric or logical 1 (true) or 0 (false). Setting this property totrue is equivalent to right-clicking the transition and selecting . For more information, see Comment Out Objects in a Stateflow Chart.
This property is read-only.
Whether the transition is implicitly commented out, specified as a numeric or logical 1 (true) or 0 (false). The transition is implicitly commented out when you explicitly comment out an object that contains it or when you comment out its source or destination. If the transition is contained in an atomic subchart or an atomic box, this property is false unless the explicitly commented object is also contained in the atomic subchart or atomic box.
Since R2023a
This property is read-only.
Whether the transition is commented out, specified as a numeric or logical 1 (true) or 0 (false). This property istrue when either IsExplicitlyCommented orIsImplicitlyCommented is true.
Comment text added to the transition, specified as a string scalar or character vector. This property applies only when the IsExplicitlyCommented property is true. In the Stateflow Editor, when you point to the comment badge  on the transition, the text appears as a tooltip. When you set the
 IsExplicitlyCommented property tofalse, the value of CommentText reverts to"".
Graphical Appearance
Position of the transition endpoint at its source, specified as a two-element numeric vector [x y] of coordinates relative to the upper left corner of the chart.
Location of the transition endpoint at its source, specified as a scalar between 0 and 12 that describes a clock position.
Position of the transition endpoint at its destination, specified as a two-element numeric vector [x y] of coordinates relative to the upper left corner of the chart.
Location of the transition endpoint at its destination, specified as a scalar between 0 and 12 that describes a clock position.
Position of the midpoint of the transition, specified as a two-element numeric vector [x y] of coordinates relative to the upper left corner of the chart.
Position and size of the transition label, specified as a four-element numeric vector of the form [left top width height].
Size of the transition arrow at the destination, specified as a scalar. When you change the destination of the transition, this property resets to the value of theArrowSize property of the new destination.
Font size for the transition label, specified as a scalar. TheTransitionFont.Size property of the chart that contains the transition sets the initial value of this property.
Debugging
Debugger properties for the transition, specified as a Stateflow.TransDebug object with these properties:
Breakpoints.WhenTested— Whether to set theWhen Transition is Testedbreakpoint, specified as a numeric or logical 1 (true) or 0 (false).Breakpoints.WhenValid— Whether to set theWhen Transition is Validbreakpoint, specified as a numeric or logical 1 (true) or 0 (false).
For more information, see Set Breakpoints to Debug Charts.
Example: transition.Debug.Breakpoints.WhenTested = true;
Example: transition.Debug.Breakpoints.WhenValid = true;
Code Generation
Hierarchy
This property is read-only.
Chart that contains the transition, specified as aStateflow.Chart object.
This property is read-only.
Subviewer for the transition, specified as a Stateflow.Chart,Stateflow.State, Stateflow.Box, orStateflow.Function object. The subviewer is the chart or subchart where you can graphically view the transition.
This property is read-only.
Machine that contains the transition, specified as a Stateflow.Machine object.
This property is read-only.
Location of the parent of the transition in the model hierarchy, specified as a character vector.
Identification
Description for the transition, specified as a string scalar or character vector.
Document link for the transition, specified as a string scalar or character vector.
User-defined tag for the transition, specified as data of any type.
This property is read-only.
Session-independent identifier, specified as an integer scalar. Use this property to distinguish the transition from other objects in its parent chart.
This property is read-only.
Unique identifier, specified as an integer scalar. UnlikeSSIdNumber, the value of this property is reassigned every time you start a new MATLAB® session and may be recycled after an object is deleted.
Object Functions
| getParent | Identify parent of object |
|---|---|
| commentedBy | Identify objects that implicitly comment out a graphical object |
| dialog | Open properties dialog box |
| view | Display object in editing environment |
| highlight | Highlight graphical object |
| fitToView | Zoom in on graphical object |
Examples
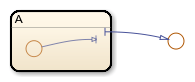
Add a transition that connects state s1 to states2 in the chart ch.
transition = Stateflow.Transition(ch); transition.Source = s1; transition.Destination = s2;
Add a label that specifies a trigger, condition, and condition action on the transition transition.
transition.LabelString = "trigger[guard]{action();}";
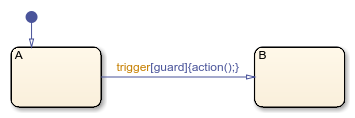
To extract the trigger, condition, and condition action specified by the transition label, enter:
trigger = transition.Trigger
condition = transition.Condition
action = transition.ConditionAction
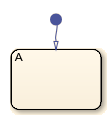
Create a Stateflow.Transition object in theStateflow.Chart object ch.
dt = Stateflow.Transition(ch);
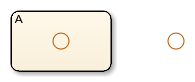
Set the destination of the transition to the Stateflow.State objectst.
dt.Destination = st; dt.DestinationOClock = 0;
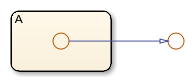
Place the source endpoint for the transition 30 pixels above the destination endpoint. Place the midpoint for the transition 15 pixels above the destination endpoint.
dt.SourceEndPoint = dt.DestinationEndPoint-[0 30]; dt.MidPoint = dt.DestinationEndPoint-[0 15];
Create a supertransition that connects a junction inside a subchart to a junction outside the subchart.

Open the model and access the Stateflow.Chart object for the chart.
open_system("sfSupertransitionAPIExample") ch = find(sfroot,"-isa","Stateflow.Chart");
Access the Stateflow.State object for the subchart and the Stateflow.Junction objects for the junctions.
st = find(ch,"-isa","Stateflow.State"); j1 = find(st,"-isa","Stateflow.Junction"); j2 = find(ch,"-isa","Stateflow.Junction","-depth",1);
Save the original position of the subchart to a temporary workspace variable subchartPosition.
subchartPosition = st.Position;
Convert the subchart to a normal state by setting its IsSubchart and IsGrouped properties to false.
Assertion failed: Deviant 'root deviant' not opened for transactions. Attempt to modify object of type 'StateflowDI.Junction' [id = -1 ] at kernel/deviant/Deviant.cpp:70:
When you convert a subchart to a normal state, it may change size to display its contents.
Add a transition that connects junction j1 to junction j2.
tr = Stateflow.Transition(ch); tr.Source = j1; tr.Destination = j2;
Revert the state to a subchart by setting its IsSubchart property to true. Restore the subchart to its original position.
st.IsSubchart = true; st.Position = subchartPosition;
The transition between the junctions is now a supertransition that crosses the boundary of the subchart.
Version History
Introduced before R2006a
Use the object function commentedBy and the propertyIsCommentedto investigate commented-out transitions:
- The object function commentedBy identifies the explicitly commented objects that cause a transition to be commented out.
- The property
IsCommentedindicates whether a transition is commented out. This property replaces the object functionisCommented.