temporalCount - Number of events, chart executions, or time since state became active - MATLAB (original) (raw)
Main Content
Number of events, chart executions, or time since state became active
Syntax
Description
temporalCount(`E`) returns the number of occurrences of the event E since the associated state became active.
temporalCount(`tick`) returns the number of times that the chart has woken up since the associated state became active.
The implicit event tick is not supported when a Stateflow® chart in a Simulink® model has input events.
temporalCount(`time_unit`) returns the length of time that has elapsed since the associated state became active. Specifytime_unit as seconds (sec), milliseconds (msec), or microseconds (usec).
Note
Standalone Stateflow charts in MATLAB® support using temporalCount only as an absolute-time temporal logic operator.
Examples
Access successive elements of the array M each time that the chart processes a broadcast of the event E.
In charts in a Simulink model, enter:
on E:
   y = M(temporalCount(E));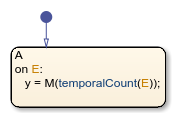
Using temporalCount as an event-based temporal logic operator is not supported in standalone charts in MATLAB.
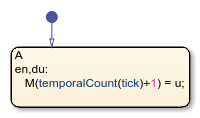
Store the value of the input data u in successive elements of the array M.
In charts in a Simulink model, enter:
en,du: M(temporalCount(tick)+1) = u;
Using temporalCount as an event-based temporal logic operator is not supported in standalone charts in MATLAB.
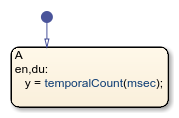
Store the number of milliseconds since the state became active.
en,du: y = temporalCount(msec);
Tips
- You can use quotation marks to enclose the keywords
'tick','sec','msec', and'usec'. For example,temporalCount('tick')is equivalent totemporalCount(tick). - The Stateflow chart resets the counter used by the
temporalCountoperator each time the associated state reactivates. - The timing for absolute-time temporal logic operators depends on the type of Stateflow chart:
- Charts in a Simulink model define temporal logic in terms of simulation time.
- Standalone charts in MATLAB define temporal logic in terms of wall-clock time.
The difference in timing can affect the behavior of a chart. For example, suppose that this chart is executing theentryaction of stateA.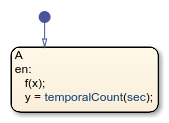
- In a Simulink model, the function call to
fexecutes in a single time step and does not contribute to the simulation time. After calling the functionf, the chart assigns a value of zero toy. - In a standalone chart, the function call to
fcan take several seconds of wall-clock time to complete. After calling the functionf, the chart assigns the nonzero time that has elapsed since stateAbecame active toy.
Version History
Introduced in R2008a