Control Chart Behavior by Using Implicit Events - MATLAB & Simulink (original) (raw)
Main Content
Implicit events are built-in events that occur during chart execution when:
- The chart wakes up.
- The chart enters a state and the state becomes active.
- The chart exits a state and the state becomes inactive.
- The chart assigns a value to an internal data object.
These events are implicit because you do not define or trigger them explicitly. Implicit events are children of the chart in which they occur and are visible only in the parent chart.
Implicit Events Based on Chart Execution
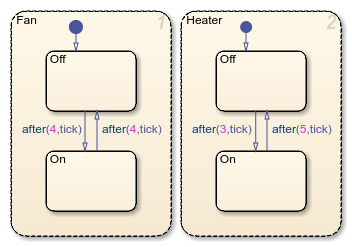
The keyword tick specifies the implicit event generated when a chart wakes up in a discrete-time simulation.
For example, in this chart, Fan and Heater are parallel (AND) states. Each state has a pair of substates, On and Off. Initially, the substates Fan.Off andHeater.Off are active. Each time the chart wakes up, it generates a tick event. The third tick triggers the transition from Heater.Off toHeater.On. Similarly, the fourth tick triggers the transition from Fan.Off toFan.On. On the eighth tick, the chart transitions back to Fan.Off andHeater.Off.
For information about the temporal logic operator after, see Control Chart Execution by Using Temporal Logic.
Note
The tick event refers to the chart containing the action being evaluated. The event cannot refer to a different chart.
Implicit Events Based on Data and States
In Stateflow® charts in Simulink® models, these operators generate implicit events when a chart sets the value of a variable or when a chart enters or exits a state.
| Operator | Syntax | Description | Example |
|---|---|---|---|
| change | change(data_name)chg(data_name) | Generates an implicit local event when the chart sets the value of the variable data_name. | Define an implicit local event when a state or transition action writes a value to the variableEngine.rpm.change(Engine.rpm) |
| enter | enter(state_name)en(state_name) | Generates an implicit local event when the specified state_state_name_ becomes active. | Define an implicit local event when the chart execution enters the stateFan.On.enter(Fan.On) |
| exit | exit(state_name)ex(state_name) | Generates an implicit local event when the specified state_state_name_ becomes inactive. | Define an implicit local event when the chart execution exits the stateFan.Off.exit(Fan.Off) |
If more than one state or data object has the same name, use dot notation to qualify the name of the state. For more information, see Identify Data by Using Dot Notation.
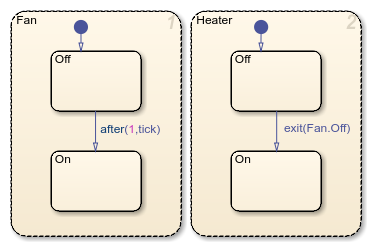
For example, in this chart, Fan and Heater are parallel (AND) states. Each state has a pair of substates, On and Off. Initially, the substates Fan.Off andHeater.Off are active. When the chart wakes up, it generates a tick event that triggers the transition fromFan.Off to Fan.On. When theFan.Off becomes inactive, the chart generates another implicit event that triggers the transition from Heater.Off toHeater.On. When the chart execution ends, the substatesFan.On and Heater.On are active.
Note
If the same implicit event triggers multiple transitions in parallel states, the order in which the transitions execute does not necessarily match the execution order of the parallel states. To avoid unexpected behavior and ensure that the transitions execute in the order specified for the parallel states, do not use implicit events. Instead, use transition conditions that call operators such as in or hasChanged. For more information, see Check State Activity by Using the in Operator and Detect Changes in Data and Expression Values.
See Also
after | change | enter | exit | hasChanged | in