hasChanged - Detect change in data since last time step in Stateflow
chart - MATLAB ([original](https://www.mathworks.com/help/stateflow/ref/haschanged.html)) ([raw](?raw))Detect change in data since last time step in Stateflow chart
Syntax
Description
`tf` = hasChanged(`data`) returns 1 (true) if the value ofdata at the beginning of the current time step is different from the value of data at the beginning of the last time step that the chart woke up. Otherwise, the operator returns 0 (false).
Examples
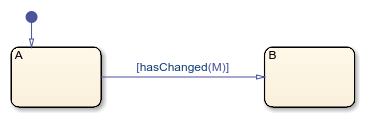
Transition out of state if any element of the matrix M has changed value since the last time step or input event.
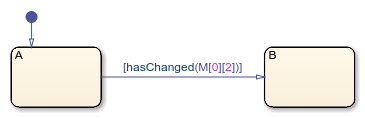
Transition out of state if the element in row 1 and column 3 of the matrixM has changed value since the last time step or input event.
In charts that use MATLAB® as the action language, use:

In charts that use C as the action language, use:
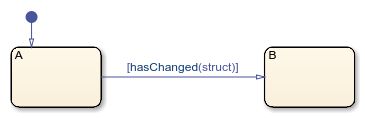
Transition out of state if any field of the structurestruct has changed value since the last time step or input event.
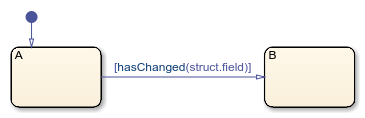
Transition out of state if the field struct.field has changed value since the last time step or input event.
[hasChanged(struct.field)]
Input Arguments
Stateflow® data, specified as a:
- Scalar
- Matrix or an element of a matrix
- Structure or a field in a structure
- Valid combination of structure fields or matrix elements
If data is a matrix, the operator returns true when it detects a change in one of the elements of data. You can also index elements of a matrix by using numbers or expressions that evaluate to an integer. SeeOperations for Vectors and Matrices in Stateflow.
If data is a structure, the operator returns true when it detects a change in one of the fields of data. You can also index fields in a structure by using dot notation. See Index and Assign Values to Stateflow Structures.
The argument data cannot be a nontrivial expression or a custom code variable.
Standalone charts in MATLAB do not support change detection on an element of a matrix or a field in a structure.
Limitations
- Unable to be used within a Stateflow truth table.
Tips
- If multiple input events occur in the same time step, the
hasChangedoperator can detect changes in data value between input events. - If the chart writes to the data object but does not change the data value, the
hasChangedoperator returnsfalse. - The type of Stateflow chart determines the scope of the data supported by the change detection operators:
- Standalone Stateflow charts in MATLAB:
Localonly - In Simulink® models, charts that use MATLAB as the action language:
Inputonly - In Simulink models, charts that use C as the action language:
Input,Output,Local, orData Store Memory
- Standalone Stateflow charts in MATLAB:
- In a standalone chart in MATLAB, a change detection operator can detect changes in data specified in a call to the
stepfunction because these changes occur before the start of the current time step. For example, ifxis equal to zero, the expressionhasChanged(x)returnstruewhen you execute the chartchwith the command:
In contrast, a change detection operator cannot detect changes in data caused by assignments in state or transition actions in the same time step. Instead, the operator detects the change in value at the start of the next time step. - In a chart in a Simulink model, if you enable the chart option Initialize Outputs Every Time Chart Wakes Up, using an output as the argument of the
hasChangedoperator always returnsfalse. For more information, see Initialize outputs every time chart wakes up. - When row-major array layout is enabled in charts that use
hasChanged, code generation produces an error. Before generating code in charts that usehasChanged, enable column-major array layout. See Select Array Layout for Matrices in Generated Code.
Version History
Introduced in R2007a