Visualize Mass-Spring-Damper Data in System Composer with Dashboard Block - MATLAB & Simulink (original) (raw)
This example uses:
This example shows how to visualize simulation data by using a Dashboard in System Composer™. In this example, you simulate a mass-spring-damper system authored in Simscape™ based on Mass-Spring-Damper with Controller (Simscape).
Link Component to Subsystem for Simscape Component Behavior
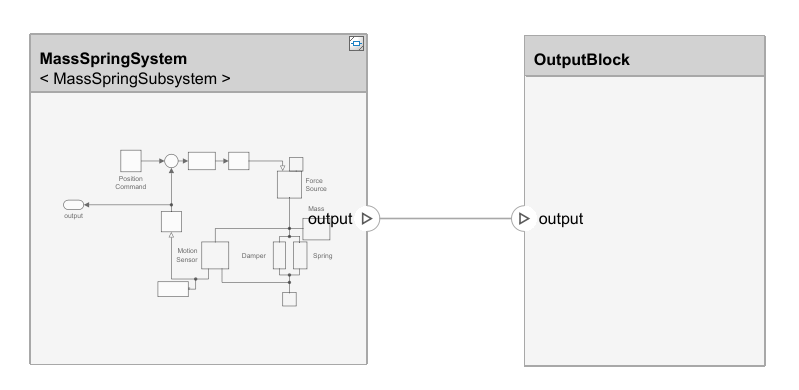
You can link a component in System Composer on an architecture model canvas to models and subsystems to take on system behavior. To link the MassSpringSystem component to the MassSpringSubsystem subsystem, right-click the MassSpringSystem component and select Link to > Model. Connect the output port of the MassSpringSystem component to the OutputBlock component. The output connector carries the signal representing the spring position.
Connect Mass-Spring Output Signal to Dashboard Block
You can now connect the system to a dashboard block to display signal values during simulation.
Choose a dashboard block from the Library Browser. Navigate to Simulink > Dashboard > Customizable Blocks. Choose a Half Gauge block for this example.
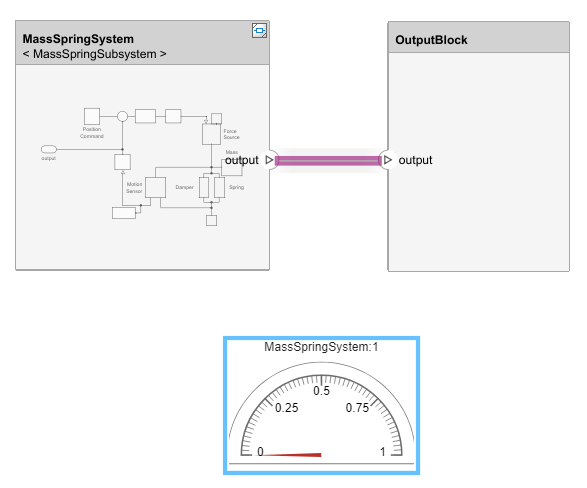
Select the Half Gauge block and from the toolstrip from the Gauge tab, select Connect to connect the Half Gauge block to the output signal. While in connection mode, select the output connector and then select the radio button under the Connect column. Select the Half Gauge block again and from the toolstrip select Done Connecting. Select the Half Gauge block and view the Property Inspector. Set the Minimum to 0 and the Maximum to 1.
Display Signal Values During Simulation with Dashboard Block
Open the System Composer model.
systemcomposer.openModel("MassSpringDashboardBlocks");
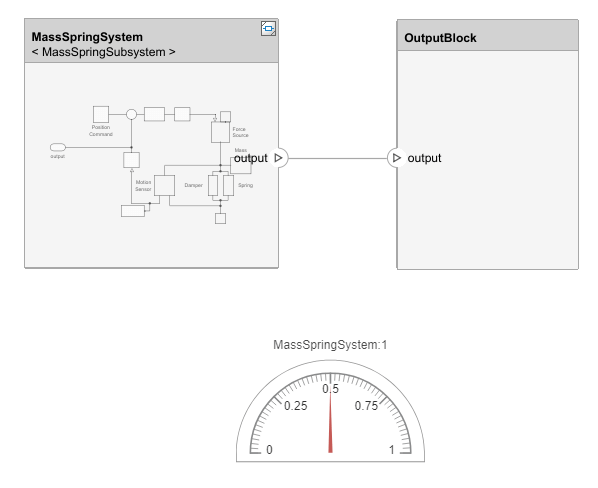
When simulating the system, you can slow down simulation speed to better inspect changes. On the Simulation tab, expand the Run button and select Simulation Pacing. Select Enable pacing to slow down simulation and keep the value of Simulation time per wall clock second as 1. Click Run to simulate the system. After simulating, the dashboard block displays the value 0.5.
See Also
Blocks
Functions
- inlineComponent | createSimulinkBehavior | createArchitectureModel | createArchitectureSubsystem | createStateflowChartBehavior | extractArchitectureFromSimulink | linkToModel | linkToFMU | isReference | isProtected