Tennessee Landforms -- Sinkholes (original) (raw)
![]()
Google map with 43 deep sinkholes ( > 100')
home arches waterfalls rocks peaks balds lakes county
Tennessee's deepest sinkholes
| Waypoint | Sinkhole | County | Locale |
|---|
Click on name of sink above for maps/pictures etc.
Waypoints: <tnsinks.gpx> or <tnsinks.mxf>
★ Google map/image/topowith deep sinkholes ★
list sorted by depth
Chuck Sutherland's www.tnlandforms.com the future (2024)
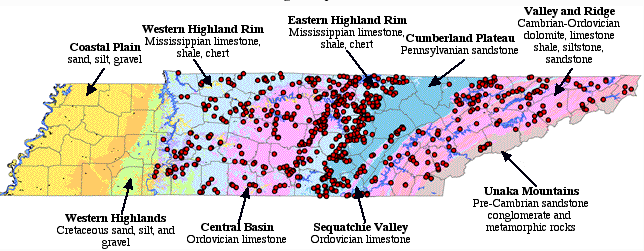
Approximately 25% of the earth's surface is karst landscape, and 20% of the US is made up of karst terrain. Tennessee sits atop a karst corridor so there are innumerable sinkholes in Tennessee, and the number is growing. The table above lists only those sinkholes with depths greater than 100'. Initial depths were estimated from USGS digital elevation data (10m DEM, see exampleor another). The first 34 were discovered by visual examination of online topo maps. Chuck Sutherland later (2013) provided a digital analysis (see below) from 10m DEM using Spatial Analyst in ArcMap that identified 9 more 100'+ sinkholes and provided depth, area, and volume.Big Sink in White County is the deepest (262.7'), but Grassy Cove, a National Natural Landmark, has the biggest area (5 square miles) and largest volume (see below for top 10 in area and volume). Additions and corrections welcome.
There are serveral impact craters in Tennessee, but they are not visually significant.
Visual analysis -- topo reconnaissance
In the 2001 Shofner study, geology students were assigned the task of scanning the state's topo maps (7.5' quadrangles) for sinkholes (hachured contours). A grid was provided for a quadrangle, and the students counted the number of sinkhole contour lines that crossed the grid lines. So rather than just a raw count of sinkholes, the metric accounted somewhat for depth and area. Here are density maps gray scale orcolorfrom the study. We were unable to locate the raw data counts from the study.
In 2013 using javascript and on-line topos (CalTopo.com), we clicked on TN sinkholes to record lat,lon. There are over 54,000 sinkholes visible on the 800 USGS TN topo quadrangles. The Talbott quadrangle has over 1,280 sinkholes, and many more uncounted beneath Cherokee Lake. (By comparison, the Bald Knob quadrangle has the highest number of caves at 345.) Counting sinkholes from the USGS topo maps or the equivalent digital DEM data reveals only the sinkholes that were visible with the photogrammetric techniques used to process the USGS aerial photos. This simple sinkhole count does not account for sinkhole volume (area*depth), so Grassy Cove counts as 1 just like one of the teeny spot sinkholes. Also topo contour interval (10', 20', or 40') can affect the number of sinkholes noted on USGS maps -- 10' contour maps typically showing more sinkholes. Most TN quads are 20' contours.
There are many more (5 times?) sinkholes than the 54,000 recorded by the USGS photogrammetric technigues. In hiking karstic areas, you will find many sinkholes that don't show on the USGS topo maps. Ongoing LiDAR aerial surveys should provide more detailed topographic data, 2013-16 surveys.
See various sinkholes per quadrangle maps below:
- google map graduated circles
- sinkhole heatmap (or heatmap using 3x3 subdivison of quad)
- choropleth quads (or color cellsusing 3x3 subdivison of quad)
- ESRI map of US karst areas with big TN sinkholes and sinks/quad
- pins on all Anderson county sinkholes, zoom and view with topo map layer (e.g. CalTopo)
- view 10m DEM elevation tick marks overlaid on deep sinkhole on google mapor on Big Sink
- lat,lon sinkhole data quad filestnsinksq.zip54,000+ lat,lon pairs (1MB)
| Quadrangle | Sinkholes |
|---|---|
| Talbott | 1284 |
| Verona | 1124 |
| Sango | 920 |
| Springfield North | 907 |
| Livingston | 896 |
| Unionville | 829 |
| Vine | 819 |
| Sparta | 813 |
513 of the state's 803 7.5' quads have at least one sinkhole (64%). 85 of the state's 95 counties have at least one sinkhole (89%). If we refine the data by dividing each quad into a 3x3 grid, then about 30% of the state's 7,227 cells have at least one sinkhole. As an example of the sinkhole clustering, see the Anderson county sinkholes.
Digital analysis 2013
Chuck Sutherland located Tennessee sinkholes in the USGS 10m DEM digital elevation data (2013) using Spatial Analyst with ArcMap. The nominal accuracy of USGS topo elevation data is half the contour-interval. Most of Tennessee topos use 20' contour, so the digital analysis summarized here only considers sinkholes with a depth of at least 3m. The ArcMap analysis provides sinkhole location (boundary path), area, perimeter, depth, and volume.
The raw data located 21,365 sinkholes (or depressions) with a depth of at least 3m. It is necessary to review the raw data and remove false sinkholes ("fauxholes"). Outliers include man-made depressions (quarries, gravel pits, clay pits, strip-mine holding ponds, levees, road impoundments) and non-karst depressions such as stream-channel depressions and depressions in the sandy soils of west Tennessee. There were also digital anomalies at some quad boundaries, perhaps, reflecting older DEM data based on 7.5' quadrangles. At least 15.4% of the data were false sinkholes -- scrubbing is ongoing.
| County | Sinkholes | DEM 3m+ |
|---|---|---|
| Robertson | 3,602 | 861 |
| Montgomery | 3,025 | 900 |
| Rutherford | 2,988 | 572 |
| White | 2,970 | 1,070 |
| Jefferson | 2,364 | 773 |
Not surprisingly, the spatial correlation coefficent is 0.93 for sinkholes per quad for the scrubbed DEM data versus the visual counts per quad (54,0000+). The table at right shows that counties with the most sinkholes have a slightly different order if only sinkholes of depth 3m or more are counted from the DEM data. For all sinkholes, Robertson County had 3,602, but for depths of at least 3m, White county has the most. A table at the bottom of the page show the regional distribution of sinkholes and caves.
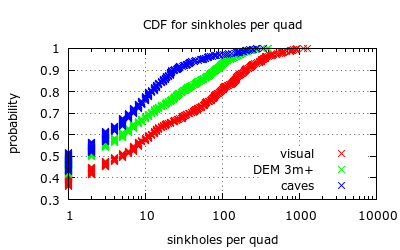 Similary, the underlying sinkholes per quad are roughly the same. For all sinkholes visible on topo, the Talbott quadrangle has the highest count at 1,284, but for DEM sinkholes with a depth of at least 3m, the Livingston quadhas the highest (391) and Talbott is second (383). (Based on scrubbed 3m+ DEM data). The CDF shows the density of sinkholes (caves) per quad -- 36% of the quads have no visual sinkholes, 42% have no sinkholes of depth 3m+, and 43% have no caves. To see differences in detail of visual analysis sinkholes (black pin) versus the 3m+ DEM sinkholes (red circle) view the Anderson countydata,topo sinkholes. There were 625 visual sinkholes on topo map, and the digital analysis reported 239 sinkholes of depth 3m or more (288 unscrubbed). The spatial distribution of visual vs digital sinkholes over Anderson county is roughly the same (hence the high spatial correlation).
The scrollable table below lists caves and sinkholes per county and the sinkholes of distinction for each county -- deepest, largest area, largest volume. The last four columns are based on the digital analysis of sinkholes with a depth of at least 3m (scrubbed data).
| County | Sinkholes | Caves | sinkholes 3m+ | depth feet | area km2 | volume m3 |
|---|
| Anderson | 625 | 63 | 239 | 67.6 | 0.1671 | 158,921 |
|---|---|---|---|---|---|---|
| Bedford | 1,382 | 109 | 297 | 70.2 | 3.2608 | 837,298 |
| Benton | 12 | 0 | 0 | 0 | 0 | 0 |
| Bledsoe | 150 | 24 | 55 | 53.8 | 0.1061 | 59,833 |
| Blount | 1,080 | 87 | 415 | 199.1 | 0.6977 | 1,526,579 |
| Bradley | 129 | 3 | 30 | 31.2 | 0.0612 | 15,757 |
| Campbell | 759 | 39 | 287 | 119.1 | 0.2779 | 214,349 |
| Cannon | 42 | 133 | 15 | 30.2 | 0.0251 | 9,628 |
| Carroll | 25 | 1 | 4 | 22.3 | 0.0582 | 19,016 |
| Carter | 349 | 69 | 190 | 104.3 | 1.2049 | 1,284,326 |
| Cheatham | 165 | 33 | 28 | 26.9 | 0.2078 | 60,897 |
| Chester | 3 | 0 | 2 | 23.0 | 0.0374 | 10,870 |
| Claiborne | 1,641 | 165 | 792 | 164.7 | 0.4712 | 1,001,104 |
| Clay | 286 | 48 | 102 | 50.5 | 0.5063 | 297,250 |
| Cocke | 760 | 63 | 393 | 118.1 | 0.3596 | 280,828 |
| Coffee | 447 | 67 | 71 | 52.5 | 1.1025 | 441,673 |
| Crockett | 0 | 0 | 0 | 0 | 0 | 0 |
| Cumberland | 54 | 164 | 24 | 140.1 | 13.6108 | 37,736,946 |
| Davidson | 609 | 87 | 148 | 62.0 | 0.5090 | 149,152 |
| Decatur | 47 | 19 | 23 | 48.9 | 0.1582 | 67,901 |
| DeKalb | 131 | 133 | 54 | 48.2 | 0.2021 | 70,461 |
| Dickson | 183 | 33 | 62 | 49.9 | 0.2900 | 130,843 |
| Dyer | 0 | 0 | 0 | 0 | 0 | 0 |
| Fayette | 0 | 0 | 0 | 0 | 0 | 0 |
| Fentress | 445 | 655 | 156 | 84.3 | 0.3529 | 166,336 |
| Franklin | 782 | 493 | 180 | 242.1 | 4.5087 | 4,303,666 |
| Gibson | 0 | 0 | 0 | 0 | 0 | 0 |
| Giles | 193 | 25 | 75 | 52.2 | 0.2182 | 88,226 |
| Grainger | 1,418 | 106 | 588 | 74.5 | 0.2336 | 68,002 |
| Greene | 1,618 | 107 | 664 | 86.9 | 0.7001 | 553,511 |
| Grundy | 78 | 313 | 36 | 155.8 | 0.4107 | 163,505 |
| Hamblen | 1,491 | 79 | 517 | 72.5 | 0.5234 | 193,114 |
| Hamilton | 531 | 84 | 226 | 94.8 | 0.3334 | 146,848 |
| Hancock | 817 | 81 | 431 | 108.9 | 0.2179 | 252,806 |
| Hardeman | 1 | 0 | 0 | 0 | 0 | 0 |
| Hardin | 54 | 16 | 24 | 76.1 | 0.1994 | 151,195 |
| Hawkins | 1,919 | 55 | 780 | 97.4 | 0.3878 | 375,411 |
| Haywood | 0 | 0 | 0 | 0 | 0 | 0 |
| Henderson | 29 | 0 | 1 | 15.1 | 0.0073 | 1,953 |
| Henry | 52 | 0 | 9 | 24.6 | 0.0614 | 13,007 |
| Hickman | 111 | 85 | 39 | 32.8 | 0.1961 | 48,473 |
| Houston | 72 | 14 | 23 | 26.9 | 0.0597 | 17,961 |
| Humphreys | 40 | 4 | 12 | 28.2 | 0.0502 | 18,308 |
| Jackson | 40 | 75 | 11 | 43.0 | 0.0519 | 24,332 |
| Jefferson | 2,364 | 103 | 773 | 76.8 | 0.3856 | 326,747 |
| Johnson | 20 | 25 | 12 | 47.9 | 0.0218 | 15,469 |
| Knox | 1,663 | 167 | 697 | 77.4 | 2.2135 | 1,535,832 |
| Lake | 0 | 0 | 0 | 0 | 0 | 0 |
| Lauderdale | 0 | 0 | 0 | 0 | 0 | 0 |
| Lawrence | 27 | 30 | 11 | 21.7 | 0.1862 | 47,989 |
| Lewis | 9 | 12 | 2 | 42.7 | 0.0122 | 7,840 |
| Lincoln | 92 | 18 | 29 | 66.6 | 0.1211 | 25,922 |
| Loudon | 795 | 22 | 327 | 72.5 | 1.2930 | 1,065,106 |
| Macon | 36 | 38 | 12 | 48.2 | 0.1237 | 49,246 |
| Madison | 3 | 0 | 3 | 16.4 | 0.0118 | 3,466 |
| Marion | 110 | 660 | 39 | 108.9 | 0.0249 | 16,163 |
| Marshall | 2,312 | 44 | 366 | 73.2 | 0.6609 | 121,850 |
| Maury | 1,347 | 75 | 330 | 42.3 | 0.2392 | 93,298 |
| McMinn | 427 | 12 | 168 | 49.9 | 0.2396 | 105,140 |
| McNairy | 1 | 0 | 0 | 0 | 0 | 0 |
| Meigs | 246 | 4 | 105 | 47.2 | 0.1058 | 65,192 |
| Monroe | 696 | 13 | 306 | 94.2 | 0.6779 | 360,181 |
| Montgomery | 3,025 | 81 | 900 | 84.3 | 2.6746 | 1,130,081 |
| Moore | 76 | 14 | 28 | 62.3 | 0.0930 | 62,127 |
| Morgan | 8 | 2 | 2 | 28.9 | 0.0053 | 2,046 |
| Obion | 0 | 0 | 0 | 0 | 0 | 0 |
| Overton | 2,026 | 564 | 877 | 152.2 | 2.2532 | 2,971,017 |
| Perry | 36 | 67 | 19 | 39.7 | 0.0744 | 34,181 |
| Pickett | 307 | 188 | 134 | 53.1 | 0.3581 | 131,487 |
| Polk | 149 | 6 | 36 | 77.4 | 0.2692 | 148,011 |
| Putnam | 535 | 575 | 264 | 206.0 | 4.2106 | 8,530,852 |
| Rhea | 203 | 9 | 78 | 47.2 | 0.1155 | 81,848 |
| Roane | 446 | 50 | 197 | 76.8 | 0.2637 | 186,734 |
| Robertson | 3,602 | 162 | 861 | 67.9 | 1.1984 | 527,084 |
| Rutherford | 2,988 | 130 | 572 | 76.8 | 1.4227 | 343,784 |
| Scott | 6 | 10 | 2 | 12.1 | 0.0096 | 1,693 |
| Sequatchie | 36 | 24 | 14 | 43.3 | 0.0821 | 47,539 |
| Sevier | 586 | 64 | 236 | 79.1 | 0.6025 | 486,887 |
| Shelby | 0 | 0 | 0 | 0 | 0 | 0 |
| Smith | 150 | 105 | 31 | 45.9 | 0.0786 | 39,636 |
| Stewart | 145 | 14 | 29 | 53.5 | 0.2044 | 85,549 |
| Sullivan | 1,876 | 167 | 672 | 89.2 | 0.4402 | 309,614 |
| Sumner | 371 | 42 | 53 | 47.6 | 1.2270 | 758,651 |
| Tipton | 0 | 0 | 0 | 0 | 0 | 0 |
| Trousdale | 87 | 12 | 22 | 65.6 | 0.1368 | 49,576 |
| Unicoi | 3 | 9 | 1 | 23.0 | 0.0263 | 10,712 |
| Union | 706 | 58 | 289 | 82.3 | 0.2086 | 241,526 |
| Van_Buren | 653 | 836 | 228 | 141.4 | 2.2759 | 1,334,351 |
| Warren | 1,596 | 495 | 598 | 182.1 | 4.8722 | 3,164,142 |
| Washington | 944 | 39 | 293 | 68.6 | 0.5232 | 277,137 |
| Wayne | 21 | 37 | 10 | 46.9 | 0.0734 | 20,042 |
| Weakley | 3 | 0 | 0 | 0 | 0 | 0 |
| White | 2,970 | 1,169 | 1,070 | 260.5 | 3.5128 | 3,987,376 |
| Williamson | 217 | 32 | 45 | 38.4 | 0.0602 | 17,153 |
| Wilson | 1,882 | 123 | 331 | 47.9 | 0.6967 | 207,611 |
county sinkholes of distinction
Metropolitan sinkholes
| City | Sinkholes | per sqmile |
|---|---|---|
| Chattanooga | 154 | 1.0 |
| Clarksville | 1,181 | 12.3 |
| Jefferson City | 29 | 9.1 |
| Knoxville | 234 | 3.0 |
| McMinville | 67 | 8.4 |
| Murfreesboro | 87 | 2.9 |
| Nashville | 608 | 8.3 |
| Sparta | 79 | 13.2 |
There are numerous sinkhole/depressions in Lauderdale County along the Mississippi River.
The table at right shows the number of topo sinkholes in a few metropolitan areas. A Cookeville 2009 sinkhole floodplain report based on LiDAR found 217 sinkholes (our topo count is 52, 27 for 3m+). Chuck Sutherland's Sparta analysis using 2017 TN LiDAR elevation data. For a coarser state-wide view, see choropleth map and zoom in using topo base map (Caltopo) to see topo sinkholes.
Here are various Google maps of digital analysis for sinkholes with depth of 3m+ on 3x3 grid over 7.5' topo quad. Each cell is 2.5'x2.5' equivalent to the Shofner block.
- choropleth sinkhole count mapor heatmap
- choropleth sinkhole depth mapor heatmap, metric is sum of sinkhole depths in cell
- choropleth sinkhole area mapor heatmap, metric is sum of sinkhole areas in cell
- choropleth sinkhole volume mapor heatmap, metric is sum of sinkhole volumes in cell
- if we subtract out digital sinkholes (3m+) from visual count, we're left with this map of shallow visual sinkholes 36,299 shallow sinkholes (heatmap)
- Anderson County sinkholes map visual (black pins) and 3m+ (red circles)
The following tables summarize the 3m+ digital data and give the top 10 sinkholes in volume and area.
Sinkhole depth
The following table shows the distribution of depth or greater over the collection of sinkholes.
| Depth (ft) | Sinkholes | raw |
|---|---|---|
| 3m+ | 18,081 | 21,365 |
| 10' | 17,522 | 20,519 |
| 20' | 7,058 | 7,977 |
| 30' | 2,771 | 3,152 |
| 40' | 1,195 | 1,361 |
| 50' | 569 | 664 |
| 100' | 41 | 53 |
| 200' | 3 | 4 |
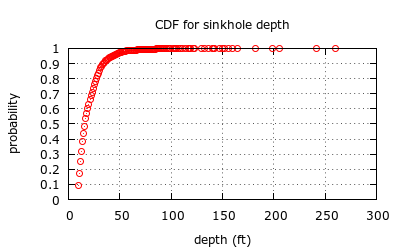
The raw data reported 53 deep-hole candidates, but 10 of those were quarries and two were road impoundments. The 43 deepest sinkholes are listed in the table at the top of the page (list sorted by depth). The cumulative distribution show that 50% of the sinkholes have a depth of 16' or less and 95% have a depth of 44' or less. Our visual analysis would suggest there are 36,000+ sinkholes with a depth less than 3m (map). If we had digital data for sinkholes less than 3m, then our CDF's would have a different shape.
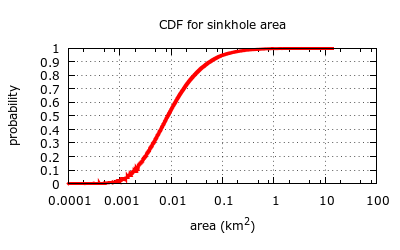
Sinkhole area
The following table lists the 10 biggest sinkholes by area (minimum depth 3m).
| Sinkhole | Area (km2) |
|---|---|
| Grassy Cove | 13.6 |
| Collier | 4.9 |
| Sinking Cove | 4.5 |
| Burtons | 4.2 |
| Old Zion | 3.5 |
| Lost Creek | 3.5 |
| Byler Bottoms | 3.3 |
| Walnut Grove | 2.9 |
| Lake Karen | 2.7 |
| Fort Campbell | 2.7 |
 Some of the sinkholes above do not show an enclosing sinkhole contour on the topo maps, but the digital analysis provides the coordinates for the enclosing path (for example, see Collier). Spatial Analyst seems to underestimate size ofNorthcutts Cove sinkhole???
The following table shows the cumulative distribution of area over the collection of 3m+ sinkholes (raw and scrubbed data).
| Area (km2) | Sinkholes | raw |
|---|---|---|
| 0.0006 | 18,026 | 21,150 |
| 0.001 | 17,774 | 20,754 |
| 0.01 | 8,215 | 9,703 |
| 0.1 | 907 | 1,152 |
| 1 | 40 | 53 |
| 10 | 1 | 1 |
Sinkhole volume
The following table lists the 10 biggest sinkholes by volume.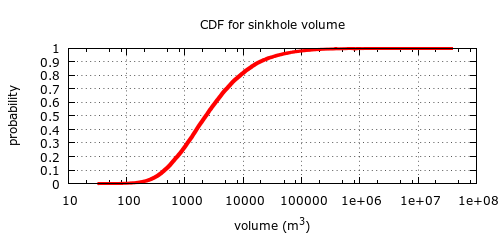
| Sinkhole | Volume (106m3) |
|---|---|
| Grassy Cove | 37.3 |
| Icy Cove | 8.5 |
| Sinking Cove | 4.3 |
| Lost Creek | 4.0 |
| The Big Sink | 4.0 |
| Big Sink | 3.2 |
| Big(gest) Sink | 3.1 |
| Cane Hollow | 3.0 |
| Lake Karen | 2.5 |
| Round Cove | 2.4 |
The following table lists the counties with the largest cumulative volume of sinkholes.
| County | 104m3 |
|---|---|
| Cumberland | 4071 |
| White | 3874 |
| Putnam | 1972 |
| Warren | 1891 |
| Franklin | 1776 |
| Overton | 1730 |
| Montgomery | 1631 |
The following table lists the USGS 7.5' topo quadrangles with the largest cumulative volume of sinkholes.
| quad | 104m3 |
|---|---|
| Grassy Cove | 4009 |
| Monterey Lake | 1173 |
| Doyle | 1125 |
| Dry Valley | 881 |
| Cardwell Mountain | 829 |
See sinkholes per quadrangle chloropleth map
visiting sinkholes
Most of the Tennessee sinkholes are on private property, but you can visit the following:
- drive thru Grassy Coveor Sinking Cove
- Norris watershed, Eli Nine Sinkholes Trail, only one of the sinkholes shows on topo, hiking GPS track
- Loyston Point trails Hemlock Bluff, Norris Lake
- Cedars of Lebanon State Park35+ sinkholes along Hidden Springs Trail
- Dodson sinkhole Falls
- Panther Creek state park seven sinkholes trail
- Sinkhole trail in Knoxville'sHastie Park
- Sinkhole Crest Trail in Oak Ridge atUT arboretum
- Sinkhole trail in Oak Ridge North Bounday greenway
- Haw Ridge Park small to tiny
- Wilderness Trail in Murfreesboro's Barfield Crescent Park
- Hickory Ridge Nature Loop in Henry Horton State Park
- Three Hickories Trail along Percy Priest Lake
- Inland Trail in Long Hunter State Park
- Cookeville's Ensor Sink Natural Area 36.150598,-85.505225
- sinkholes along Tellico's East Lakeshore Trail
- sinkholes along Black Mountain section ofCumberland Trail
- sinkholes in Chuck Swan WMAUnion County's deepest sinkhole 36.324493,-83.956961
- two deep sinkholes in the Great Smoky Mountains National Park
- Icy Cove
- scenic Shortfoot's Natural Bridge over sinkhole pond in Monroe County
- Virgin Falls comes out of a cave and drops into a sinkhole
Spatial density of Tennessee sinkholes and caves 
| County | Sinkholes | Caves |
|---|---|---|
| Anderson | 625 | 63 |
| Davidson | 609 | 87 |
| Hamilton | 531 | 84 |
| Jefferson | 2,364 | 103 |
| Knox | 1,663 | 167 |
| Marshall | 2,312 | 44 |
| Montgomery | 3,025 | 81 |
| Robertson | 3,602 | 162 |
| Van Buren | 653 | 836 |
| White | 2,970 | 1,169 |
| see ESRI map |
The Tennessee Cave Society (TCS) has coordinates for the state's 11,283caves (2020), site includes cave-density map and caves per county. Using Sutherland's cumulative data for caves-per-county and caves-per-quadrangle, we can compare topo sinkhole and cave density. (The 2001Shofner study also compared cave and sinkhole density.) The table at right highlights the county cave and sinkhole density (see full table above) and the following maps illustrate the density.
- caves-per-county map 2017 or2013or2012 or2011(courtesy Chuck Sutherland)
- ESRI caves/county (2012) map graduated circles with sinkholes/county
- 2013 caves per quad Google choropleth mapor Google graduated circles map or Google heatmap
- Sutherland's 2013 cave and sinkhole density mapbased on 3m+ deep sinkholes weighted by volume
- 2001 Shofner density maps
The Shofner paper reports spatial correlation (0.20) between caves and sinkholes. Using our sinkholes/quad count (visual analysis) and TCS caves/quad count, we calculate a spatial correlation of 0.35 for the whole state. The spatial correlation drops to 0.30 if we exclude quads with no caves and no sinkholes. The correlation of caves to sinkholes of 3m+ depth (digital analysis) is 0.26. About 36% of the state 7.5' quads and 10 of the 95 counties have no caves and no sinkholes.
Notable public caves Lost Sea,Ruby Falls,Dunbar Cave,Bell Witch Cave, Big Bone Cave,Cumblerland Caverns,Tuckaleechee Caverns,Raccoon Mountain Caverns, and Forbidden Caverns.Blue Spring Cave is the most extensive TN cave (35 miles).
Caves and surface geology:
Additional information
- Google map/image/topowith deep sinkholes and elevation query tools
- leafletjs (non-google) TN sinkholes map
- TN physiographyor geologic map of Tennessee
Regional sinkhole distributionRegion Sinkholes DEM 3m+ Caves Western <1% <1% <1% Highland Rim W 14% 11% 7% Central Basin 22% 15% 11% Highland Rim E 15% 16% 33% Plateau 4% 6% 31% Valley 42% 50% 16% Mountains 1% 1% 2% - more about TN sinkholes
- Shofner paper on TN sinkhole index and gray-scale sinkhole density map 2001
- another TN sinkhole and cave distribution based on Shofner data (color maps)
- Using GIS to identify sinkholes 2011
- karst subsidence in East TN 1988
- Unicoi county sinkhole
- Clarksville karstand I24 sinkholeand 2014 Austin-Peay sinkholeand earthcache urban sinkhole
- Knoxville, James White Parkway TDOT 2008karst study and 2013 karst study
- Knoxville Karst Hydrogeology of the Ten Mile Creek Watershed 2009
- Knox county sinkhole drainage basins 1973
- Cookeville sinkhole floodplain report 2009 (LiDAR), 217 sinkholes (our topo count is 52, 27 3m+)
- Chuck's LiDAR analysis Sparta, TN 2017
- Karst aquiefers in Tennessee
- more TN geology info
- Tennessee Topography, bulletin #86, David Starnes, 2009
- USGS US sinkholes with karst map and 2004 USA karst mapanother US cave/karst mapor US cave density
- Appalachian karst map cave density, 2005
- Using LiDAR to map sinkholes W Va 2008, 33 sinkholes, my visual USGS scan shows 56
- LiDAR and sinkhole plain of Illinois 2012
- wikipedia sinkhole infoand how sinkholes workor USGS science of sinkholes
- Kentucky sinkholes
- GIS shapefiles 107,176 sinkholes, area but no depth data, largest area: 7,724 acres,area CDF
- KY karst map
- Coincidence between sinkholes and geologic structure KY
- KY sinkholes cross-section
- KY groundwater resoures by county, karst map
- sinkhole info for NCor ALand hereor PA sinkhole mapor VA sinkholes andESRI map
- Illinois county sinkholes examples of old aerial photos of sinkholes (1940)
- sinkhole density Columbia quadrangle Illinois, highest density: 135/sq mile
- LiDAR in Tennessee map and 2014-2018 LiDAR surveybusiness plan andtechnical specs (18 cm veritcal RMSE)
- TN 2013-16 LiDAR surveys
- using LiDAR to map WV sinkholesand LiDAR and Smokies sinkholes
- Iowa lidar sinkhole mapping2012
- An Evaluation of Automated GIS Tools for Delineating Karst Sinkholes and Closed Depressions from 1-meter LiDAR-derived Digital Elevation Data
- TN GIS ecoregions ESRI map
- urban sinkholes
- Tennessee-Georgia-Alabama (TAG region) cave density
- USGS National Elevation Dataset NED
- Andy's US big hole list and on Google mapand list with lat/lonand see Saline Valley an endorheic basin
- US lowpoint guide
- world's largest sinkholes/depressionsand Mexico's deepest water-filled sinkholeand Belize Great Blue Hole 1000 feet across and more than 400 feet deep
- China sinkholes
- deepest lakes
- Yahoo prominence forum and subsidence and prominence/basin theory
- anti-prominence sinkholes, basins greater than 300', US map
- TN county high points
- TN topo maps by countyand state-wide index (pdf) and alphabeticalor here
Tennessee landforms home arches waterfalls rocks peaks balds lakes regions county
GSMNP landforms (TN/NC) BSF landforms (TN/KY)
©Tom Dunigan
Revised Thu, 06 Feb 2025 11:13:25 -0700
Chuck Sutherland's www.tnlandforms.com the future (2024)